American:
What happened to the Dream?
May/Jun 2024


What has gone wrong at American Airlines? It is the world’s largest airline under various measures: the largest number of aircraft with a fleet of over 1,500 tin cans; it carried more than 210 million passengers in 2023. But it trails its major network competitors in the US (the world’s next two largest airlines) in terms of revenues, margins, profits and balance sheet health.
A decade ago, American emerged from Chapter 11 bankruptcy protection and acquired US Airways to provide the last element in the consolidation of the US Legacies. That filing for Chapter 11 had been forced on it by the bankruptcies and restructuring (and subsequent consolidating mergers) of its two main rivals Delta/Northwest and United/Continental. But it emerged substantially larger and with a competitive cost base. Between 2014 and 2019 American reported a period of very strong earnings, with its operating profit margin peaking at 18% in 2015.
But in that period, they also used a large portion of cash flow to pay dividends and buy back shares to “reward investors”. This left the group with a negative shareholders' equity of $(118)m as they entered the existential crisis of the pandemic.
| 2019 | 2020 | 2021 | 2022 | 2023 | @ 31 Mar | 2024 | ||
|---|---|---|---|---|---|---|---|---|
| Turnover | 45,768 | 17,337 | 29,882 | 48,971 | 52,788 | Operating property∗ | 39,056 | |
| Net profits | 1,686 | (8,885) | (1,993) | 127 | 822 | Intangibles and other | 10,786 | |
| Operating cash flow | 3,815 | (6,543) | 704 | 2,173 | 3,803 | Cash† | 9,195 | |
| Net capex | (3,203) | (964) | (51) | (3,080) | (2,091) | Current assets | 5,347 | |
| Free cash flow | 612 | (7,507) | 653 | (907) | 1,712 | Total Assets | 64,384 | |
| Increase in debt | (293) | 8,024 | 4,828 | 2,631 | (3,206) | Current liabilities | (24,993) | |
| Equity | (1,275)‡ | 2,970 | 460 | Debt§ | (34,685) | |||
| Total cash flow | (956) | 3,487 | 5,941 | 1,724 | (1,494) | Other liabilities | (10,206) | |
| Total Liabilities | (69,884) | |||||||
| Shareholders’ Equity | (5,500) |
And since 2014 the group has been through a a massive fleet renewal process. Between then and 2022 it took delivery of 630 new aircraft, retired 580 planes and, it claims, delivered the largest reconfiguration programme in aviation history.
It suffered badly (as any airline did) when Covid hit: in the two years of the depths of the pandemic it lost $11.5bn at the operating level and $10.8bn at the net — although this was only half the profits it had garnered in the previous five years. The group raised $3.3bn in new equity but it also took on a lot of debt to cover these losses: total long term debt and lease liabilities peaked at $48bn in June 2021 up from $29bn at the end of 2019 (excluding pension liabilities of over $6bn). Shareholders' equity at the end of June 2022 stood at a deficit of $(7.7)bn.
The crisis gave it the opportunity to progress the fleet renewal. Since 2019 American has reduced the number of aircraft types in its mainline fleet from eight to four — disposing of A330s, 767s, 757s and E190s to concentrate on 777s, 787s, A320s and 737s — which has left it with a fleet age at the end of 2023 of 13 years.
Investor Day optimism
At the beginning of March, the group held its first Investor Day in seven years. Led by CEO Robert Isom (who took over the position in 2022) the presentation described a return to strong profitability, targeting EBITDAR margins of 15-18%, annual free cash flow of over $3bn by 2026, and debt (including pensions) back below $35bn. Isom’s story is that American has five main value-creating drivers:
- Fleet: The aircraft fleet is relatively young and has been simplified through the massive renewal programme since 2014. Capital expenditure is likely to be no more than $2-3bn a year.
- Operational excellence: American claims a strong reliable operation, boasting a 98.9% completion rate in 2023. It even managed on time performance of 79%, slightly behind Delta and Alaskan.
- Network: it claims to have the strongest domestic and short-haul international route network.
- Rewards: its AAdvantage FFP is a leading travel rewards programme. But its co-branded cards agreements were last established ten years ago. It it looking to renegotiate agreements (with Citi and Barclays?) seeking a bank to create “the largest branded credit card”.
- Re-engineering the business: The simplified fleet is seen as providing a route to better asset utilisation; and the group is taking a deep dive into its procurement processes.
On the same day the group announced that it had placed an order for 85 A321neos, 85 737-MAX 10, and 90 Embraer 175, complementing its existing orders for 787s and A321XLRs (see table).
| Planned deliveries | |||||||||||||
|---|---|---|---|---|---|---|---|---|---|---|---|---|---|
| Avg seats | Avg Age | Dec 2023 | Δ v2019 | 2024 | 2025 | 2026 | 2027 | 2028 | 2029+ | Total | |||
| Widebodies | A330-200 | 247 | ↓15 | ||||||||||
| A330-300 | 291 | ↓9 | |||||||||||
| 767-300ER | 209 | ↓17 | |||||||||||
| 777-200ER | 273 | 23.0 | 47 | ||||||||||
| 777-300ER | 304 | 9.8 | 20 | ||||||||||
| 787-8 | 234 | 5.1 | 37 | ↑17 | 6 | 5 | 4 | 5 | 5 | 5 | 30 | ||
| 787-9 | 285 | 6.2 | 22 | ||||||||||
| Total | 12.7 | 126 | ↓24 | 6 | 5 | 4 | 5 | 5 | 5 | 30 | |||
| Narrowbodies | A319 | 128 | 19.7 | 133 | ↑1 | ||||||||
| A320 | 150 | 22.7 | 48 | ||||||||||
| A321 | 178 | 11.4 | 218 | ||||||||||
| A321neo | 195 | 2.9 | 78 | ↑66 | 3 | 16 | 21 | 31 | 14 | 64 | 149 | ||
| 737-800 | 172 | 14.1 | 303 | ↓1 | |||||||||
| 737-8 MAX | 172 | 3.2 | 59 | ↑35 | 20 | 14 | 10 | 20 | 95 | 159 | |||
| 757-200 | 180 | ↓34 | |||||||||||
| E190 | 99 | ↓20 | |||||||||||
| Total | 13.0 | 839 | ↑47 | 23 | 30 | 31 | 31 | 34 | 159 | 308 | |||
| Mainline | 12.9 | 965 | ↑23 | 29 | 35 | 35 | 36 | 39 | 164 | 338 | |||
| CRJ | 66 | 254 | ↑7 | ||||||||||
| ERJ | 70 | 302 | ↑9 | 12 | 12 | 18 | 15 | 15 | 30 | 102 | |||
| Regional | 556 | ↑16 | 12 | 12 | 18 | 15 | 15 | 30 | 102 | ||||
| Group Total | 1,521 | ↑39 | 41 | 47 | 53 | 51 | 54 | 194 | 440 | ||||
Building the best network
CCO Vasu Raja tried to explain the commercial game-plan, stating: “Our short haul network is the foundation of value for customers and investors. AAdvantage is our source of value growth for customers and investors”.
From his point of view, American is a uniquely positioned global hub-and-spoke network carrier with a strong benefit from its sun-belt focus. Five of its largest hubs — Dallas, Phoenix, Los Angeles, Charlotte and Miami (see map) — are in this region of the southernmost 18 states of the Union.
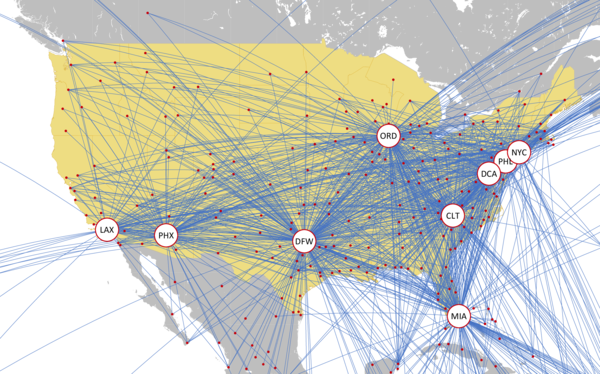
He proposes that the customer landscape is changing to American’s advantage. The population in the sun-belt states is growing: 7.6% up (12m people) in the past decade compared with 2% for the rest of the country, and forecast to increase by a further 7% in the next ten years (against 0.3% for all other states). Economic growth is trending similarly, with the sun belt economic performance between 2019 and 2022 some 124% of the national average.
Raja also suggests the competitive landscape is changing — again to American’s advantage. In 2023, the country’s 25 largest air markets had 2% more seats on offer than flown in 2019. But the 200 smallest markets had 11% fewer seats. Moreover, the 200 smallest markets in its network generated yields 63% above its average (and the largest markets 2% below average). He also states that 60% of the country’s airports have fewer than 500 passengers a day. Regional connectivity may have fallen as the majors concentrated on up-gauging — but American retains its huge fleet of regional jets with their lower trip cost advantage.
He exemplified the “unique network advantage” by using El Paso, Texas (a city of 0.6m population). American provides 14 peak-day departures with non-stop flights to four hubs (Los Angeles, Dallas, Phoenix and Chicago) delivering “global connectivity to more than 175 cities”.
He went on to argue that the American network creates the most value for customers: American, he averred, offered 30% more O&D markets than other carriers; 40% of O&D markets are unique to American; and, more than 45% of domestic traffic originates outside domestic markets. He also claimed that American offers “a superior network” (whatever that really means) in 68% of markets (up from 59% in 2019 and 51% in 2014).
International network
Raja commented that American’s operational focus is predominantly domestic — which accounts for over 70% of the Group’s passenger revenues. But, as a member of the oneworld alliance, it has links and partnerships “with other high-quality carriers” round the world.
Somewhat strangely, Raja claims that American’s network along with its partners “serve c90% of US long haul demand”.
On its international network (see map) it has a strong historic position in Latin America — heavily concentrating on short-haul services into the Caribbean and destinations in Central America — where its sun belt hubs provide an advantage. In 2022 American tied an agreement with Brazilian carrier GOL with a $200m investment (snatching the airline back from Delta’s clutches) to reinforce codeshare partner benefits in Southern America. The LatAm operations generated 14% of the group’s 2023 passenger revenues.
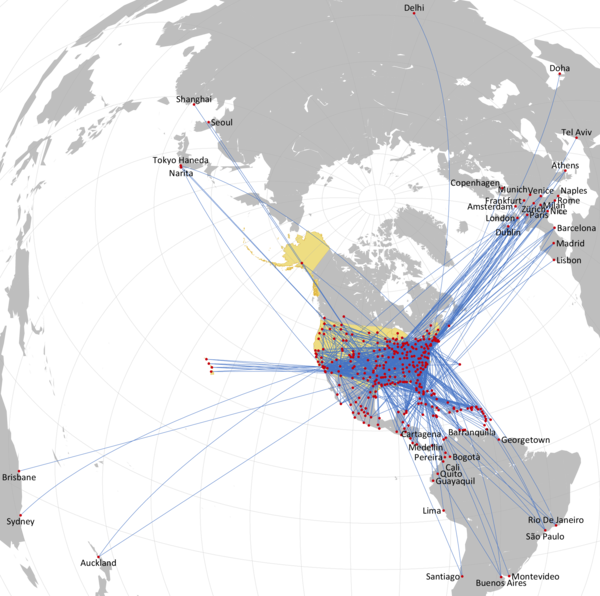
On the Atlantic (which accounts for a further 13% of revenues) it has a joint venture with IAG — the most valuable part being the link between the North East coast of the US and London (New York and London representing the two largest gateways on the North Atlantic). On routes to London, Raja pointed out that American achieves yields that are 24% higher than the average for the rest of Europe.
But with limited feed into New York and Boston, and the demise of the JetBlue Northeast alliance, it is at a slight disadvantage against its major competitors. American’s strategic alliance with Alaska Airlines covering its lack of presence on the West Coast has managed to avoid regulatory opprobrium. American also has a strategic alliance with Qatar Airways for flights from select eastern seaboard flights into the Middle East and beyond.
American is relatively weak on the Pacific, but has a joint venture with fellow oneworld member JAL (and on flights to Tokyo, Raja states that that it achieves a 13% yield premium compared with its other Asian routes) and with Qantas on routes to Australia. It also has similar relationship, and a 1% equity stake, in China Southern for routes into the PRC.
The major airlines publish figures splitting out passenger revenues by geographic regions, but none provide a similar breakdown of profitability. In the graphs we show figures for the regional performance taken from the DoT’s Form 41 filings.
Note: LTM=latest twelve month
These seem to show that the three main carriers are much on a par in the Domestic market (with Delta consistently ahead of the pack), but that American is at a structural disadvantage to its two main rivals on the Atlantic and Pacific.
However, the numbers for American on the Atlantic are somewhat unbelievable — given the comments from British Airways (and Iberia and Aer Lingus) on the power of profitability on the route that is operated as a metal neutral joint venture, it seems unlikely that American is actually losing money in such a consolidated, business-orientated market..
It could be that the Form 41 filings, developed in the heavily regulated era, are just not suited to dealing with the wonders of hub-and-spoke networks and the secrecy of joint ventures. It could be that American fudges the figures it files.
Building the best travel rewards
AAdvantage was one of the first FFPs to be established (in 1981). It is one of the largest programmes in the world, boasting over 115m members. Vasu Raja said that in 2023, 65% of American’s revenue came from passengers who were members of the programme (up from 55% in 2017) — 40% travelling in premium products, 25% in the back of the bus. A further 15% of revenues came from passengers travelling in premium seats who were not (yet) members of AAdvantage. (They still need the other 20% of revenue, but cannot say it’s a priority). He added that American “offer more premium seats than any other airline”. Apart from the handful of new aircraft due in the next few years, American will be retrofitting old A319s and A320s with more first class seats, and expects that this inventory should grow by 20% over the next two years.
But he also suggested that AAdvantage is “underpenetrated in the travel landscape” — active members accounting for 23% of US air passengers, but the co-branded credit cards only 6% of air travellers.
So the programme has been re-engineered: to make it “easier” for customers to earn miles; “easier and cheaper” for companies to manage bookings; and more efficient for American.
For customers to earn miles they have to use direct channels or “modern retailers” — ie those with New Distribution Capabilities (NDC). Miles are issued on a sliding scale depending on total dollar spend, status, and method of payment. No miles are issued if a member books through a “non-preferred” agency. A fare in basic economy bought through “direct channels” gets the punter 2 miles per dollar spent. A “main fare” bought through modern retailers gets her five miles per dollar. If she has “status” this goes up to 7-11 miles/$, and using the co-branded credit card, having “status”, generates up to 16 miles/$. (When the changes were rolled out in February, it appears that American failed to announce which travel agencies it considered “preferred agencies”.)
Raja also boasts that AAdvantage offers the “most redemption value” of any reward points with a third party valuation of 1.7¢/mile, and provides “unique and unmatched benefits across the travel journey, unlocked with status”.
For corporate bookings Vasu Raja said they had eschewed the traditional model whereby customer bookings were routed through intermediaries. The business would pay agency fees to a travel management company, who would also get fees and commissions from the airline. The passenger would be credited with the base miles and loyalty points. The main point seems to be that this process used outdated technology and provided an unwanted layer of complexity.
The new programme, dubbed AAdvantage Business, was designed to cut out the middleman, and get the business to book directly (rewarding both the business and the traveller with miles and elevated loyalty points). Raja suggested that it would make it “80% less expensive for customers and 65% less expensive for American”.
Loyalty programme revenues, from marketing (co-branded cards) and from redemption, are a vital part of the US industry profitability and liquidity. In 2023 American received cash payments of $5.2bn from co-branded cards and other partners.
Volte Face
What CCO Visu Raja and CEO Robert Isom may have failed to recognise is that airline customers have a choice; or indeed identified who the customer is. As one disgruntled travel manager at Lockheed Martin, quoted in Travel Weekly, pointed out “Managed corporate travel programs manage their respective traveler groups, not the airlines. AA needs to realize that the corporate travel programs are their customers, not our travelers. Cater to the managed travel program’s needs, don’t try and fracture our programs by trying to push travelers into booking direct.”
Two months after the Investor Day presentations, at the end of May American was forced to issue what amounted to a profit warning, on the eve of a presentation at Bernstein’s annual Strategic Decisions Conference.
Total unit revenues in the quarter ending June were now expected to be 5-6% down from prior year levels, compared with earlier guidance suggesting declines of 1-3%; it had failed to implement capacity growth with ASMs expected to be flat year on year, down from c8% growth; its estimate of operating margins in the quarter was reduced by 1 percentage point to a range of 8.5%-10.5%; it now expected Q2 earnings per share of $1.00-$1.15 compared with guidance of $1.15-$1.45 made a month before. On the announcement, the shares fell by 14% in a day — the largest single-day drop since early 2020 in the depths of the pandemic.
Robert Isom admitted that the implementation of the distribution plan had been botched and had backfired, saying “We’re seeing softness in customer bookings relative to our expectations that we believe is in part due to the changes that we have made to our sales and distribution strategy.”
Speaking at that same Bernstein conference, United’s CEO, Scott Kirby, courteously suggested that the profit warning had more to do with American’s ability to forecast rather than distribution changes — United had been forced to put out a press release confirming their second quarter guidance.
The architect of that strategy, Visu Raja, was fired (after 20 years service with American Airlines), leaving the company from the beginning of June.
Isom said: “We can never be difficult to do business with… Others are benefiting from what we’ve done over the last six months or so. We’ll get that back.“; and “Raja has been an innovator... but sometimes we need a reset.”
