There is a current commercial passenger and freight aircraft order backlog of some 9,400 units equivalent to 45% of the current commercial active fleet (according to our analysis of the data from Ascend Online)
Prolongation of order backlog
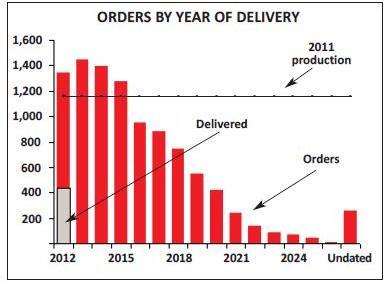
- The current backlog is equivalent to more than eight years’ current production levels — the highest level the industry has seen.
- 53% of the backlog is due for delivery by 2015.
- There are some significant long dated orders. A third of the backlog for the A320/737 and variants are for delivery beyond 2016 (with another 3% — probably
speculative — that have no firm delivery dates). - The dated orders extend over the next 14 years to 2026 — with Lion Air, IndiGo and AirAsia extending firm orders for 737s/A320s beyond 2023.
- There is a level of undated orders which may be deemed unlikely to be fulfilled — but this only accounts for 3% of the total backlog.
Orders by type of customer
- The lessors account for 15% of the total order book.
- The European Legacy, US Legacy carriers and the three Gulf super-connectors each account for around 5% of the total backlog.
- LCCs make up 30% of the customer base. Notably only 37% of their orders are for delivery before 2016.
- Other airlines make up 40% of the order book — and nearly 70% of their orders are for delivery by 2015.
- The largest individual orders are from Southwest, Lion Air and AirAsia.
- The top 25 customers account for 45% of the total backlog.
Geography
- Over a third of the orders are from operators in the Far East and a quarter in North America — although half of the North American orders are from leasing companies.
- Europe appears slightly under-represented with only 18% of the total backlog (and 15% of the backlog ordered by airlines).
- Two-thirds of the European orders are for delivery before 2016. • The majority of the orders from the Middle East are for delivery after 2015.
Types on order
- Narrowbody aircraft account for two-thirds of the aircraft on order and widebody aircraft a quarter of the total.
- The delays in the production programmes have impacted some widebody replacement programmes, so the scale of widebody deliveries is going to be substantially higher at 250 a year than in the past decade.
- Only a quarter of the A380/747 deliveries are scheduled for after 2015.
By manufacturer
- Airbus appears slightly ahead in the duopoly fight — with 46% of the commercial backlog against Boeing’s 42%.
- Boeing is slightly ahead on deliveries scheduled before 2016 — where the market shares are reversed — helped by the 787. (The A350 deliveries are expected to start in 2014 but only start to kick in reasonably from 2016).
- Substantially all Embraer’s orders are for delivery in the next three years.