RJs on a steep climb up their S-curve
March 2001

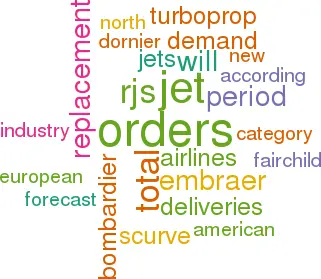
The Regional Jet phenomenon seem unstoppable. According to our estimates RJ orders accounted for 41% of a record total of 1,917 jets (see last issue for Boeing/Airbus analysis).
Our total of 786 identified orders for Embraer, Bombardier, Fairchild Dornier and BAE Systems do not quite tie in with the manufacturers' official total of 778 gross orders. But, given the number of switches between RJ types and between turboprops and RJs, the difference is not significant. Embraer has emerged as the dominant manufacturer taking 56% of the orders against 31% for Bombardier. Fairchild Dornier represents a third force with 11% while BAE now just has a peripheral role.
Given the experience of consolidation in the large jet sector, will a similar merger process take place in the RJ industry? Already Fairchild Dornier is cutting back on its product range by discontinuing the 428JET, and is being discounted as a competitor by Bombardier though not yet by Embraer.
What seems to happening is that the RJs industry is somewhere on the steep slope of an S–curve. Ed Greenslet of ESG draws an interesting parallel between the RJ phenomenon and the jet revolution that occurred between 1958 and 1970. Over that 13–year period the proportion of jets in the world commercial fleet rose from zero to 75% (it is now 89%). Deliveries rose sharply in the period 1966–70 driven by combination of replacement of piston–engined aircraft and traffic growth; after 1970, however, deliveries halved as demand as driven almost entirely by traffic growth.
In the RJ sphere the first significant delivery year was 1993, and production really took off in 1998. So if the 13–year S–curve principle holds, the industry can expect another five years of high output (which is almost assured by the current level of the manufacturers' backlogs) followed by a marked decline as maturity is reached.
ESG’s forecast for the period 2001–2020 envisages 5,000 RJ deliveries plus 1,120 in the 110–seats category (A318, 717 and 737- 600); the small jet total of 6,120 is equivalent to 26% of the total jet deliveries. Two other US consultants, AvStat and Stanford Transportation, have just come up with a forecast of 8,578 small jets for the same period, equivalent to 35% of the delivery total. (It is worth recalling, however, that the proportion of world ASKs generated by RJs rises to only 4% from today’s 2% over the forecast period.)
The factors behind the RJ S–curve are more complex than simply a shift from turboprops to jets. Indeed, according to Embraer, turboprop replacement itself accounts for only 9% of RJ demand, and turboprop complement for another 12%. Jet replacement (25%) and jet complement (25%) are the key drivers of RJ demand; this includes capacity rightsizing and increasing frequencies. New point–to–point routes, including hub overflight, and the development of new RJ hubs account for the remaining 29% of RJ demand.
Bombardier sees the RJ market in a similar way, but puts more emphasis on the turboprop replacement role — 14% plus 21% for turboprop supplement. Jet replacement and supplement accounts for 39% and new routes for 26%.
Last year North American carriers placed 57% of the RJs orders, including megaorders from Continental Express and American Eagle. The only outstanding mega–order might be from Mesa.
Attention will then switch to Europe where the size of the individual orders will not be of the same size but the focus will be on the larger RJs. This is because European airlines are not as constrained as their US counterparts by scope agreements.
According to Embraer, North American airlines will continue to dominate orders for 30- 60 seater category over the next ten years, taking 66% of orders as against 18% for European airlines, but in the 61–90 seat category European airlines are expected to place 49% of the orders against 26% for the North Americans.
| Avro RJ | BAE | 328 | 428 | 728 | 928 | Fairchild | |
| RJ | total | JET | JET | JET | JET | Dornier total | |
| European airlines | |||||||
| Air Adriatic | 0 | 2 | 2 | ||||
| Air Botnia | 5 | 5 | 0 | ||||
| CityFlyer Express | 6 | 6 | 0 | ||||
| Gandalf | 0 | 5 | 5 | ||||
| Grossman AS | 0 | 1 | 1 | ||||
| KLM Alps | 0 | 3 | 4 | 7 | |||
| Shell Petroleum | 0 | 2 | 2 | ||||
| European total | 11 | 11 | 13 | 4 | 0 | 0 | 17 |
| North American airlines | |||||||
| Skyway | 0 | 5 | 5 | 10 | |||
| North American total | 0 | 0 | 5 | 5 | 0 | 0 | 10 |
| Asian airlines | |||||||
| Druk Air | 2 | 2 | 0 | ||||
| Asian total | 2 | 2 | 0 | 0 | 0 | 0 | 0 |
| Lessors | |||||||
| Bavaria Leasing | 0 | 2 | 5 | 7 | |||
| GECAS | 0 | 50 | 50 | ||||
| Lessors total | 0 | 0 | 0 | 0 | 52 | 5 | 57 |
| TOTAL ORDERS | 13 | 13 | 18 | 9 | 52 | 5 | 84 |
| ERJ | ERJ | ERJ | ERJ | ERJ | Embraer | CRJ | CRJ | CRJ | Bombardier | |
| -135 | -140 | -145 | -170 | -190 | total | -200 | -700 | -900 | total | |
| European airlines | ||||||||||
| Air Dolomiti | 0 | 3 | 3 | |||||||
| Air Moldova | 2 | 2 | 0 | |||||||
| Air Nostrum | 0 | 12 | 12 | |||||||
| Axon | 4 | 4 | 0 | |||||||
| Brit Air | 0 | 8 | 8 | |||||||
| City Airlines AB | 1 | 1 | 0 | |||||||
| LOT | 9 | 9 | 0 | |||||||
| Lufthansa CityLine | 0 | 10 | 10 | |||||||
| Maersk | 0 | 2 | 2 | |||||||
| Pan Europeenne | 1 | 1 | 0 | |||||||
| Regional | 5 | 5 | 0 | |||||||
| Rheintalflug | 1 | 1 | 0 | |||||||
| European total | 7 | 0 | 16 | 0 | 0 | 23 | 15 | 20 | 0 | 35 |
| North American airlines | ||||||||||
| American Eagle | 130 | 6 | 136 | 0 | ||||||
| Atlantic Coast | 0 | 28 | 28 | |||||||
| Chatauqua | 15 | 15 | 0 | |||||||
| Continental Express25 | 86 | 111 | 0 | |||||||
| Delta Connection | 0 | 79 | 25 | 104 | ||||||
| Horizon | 0 | 5 | 5 | |||||||
| Mesa | 36 | 36 | 0 | |||||||
| N. American total | 25 | 130 | 143 | 0 | 0 | 298 | 107 | 30 | 0 | 137 |
| Asian airlines | ||||||||||
| China Yunnan | 0 | 6 | 6 | |||||||
| Japan Air Lines | 0 | 2 | 2 | |||||||
| J-Air | 0 | 2 | 2 | |||||||
| Shandong | 0 | 10 | 10 | |||||||
| Shanghai | 0 | 3 | 3 | |||||||
| Sichuan | 5 | 5 | 0 | |||||||
| Asian total | 0 | 0 | 5 | 0 | 0 | 5 | 13 | 10 | 0 | 23 |
| Other | ||||||||||
| Air Caraibes | 2 | 2 | 4 | 0 | ||||||
| Regourd | 4 | 4 | 0 | |||||||
| SA Airlink | 30 | 30 | 0 | |||||||
| Other total | 30 | 0 | 6 | 2 | 0 | 38 | 0 | 0 | 0 | 0 |
| Lessors | ||||||||||
| GECAS | 50 | 50 | 15 | 25 | 10 | 50 | ||||
| Wexford | 30 | 30 | 0 | |||||||
| Lessors total | 0 | 0 | 30 | 50 | 0 | 80 | 15 | 25 | 10 | 50 |
| TOTAL ORDERS | 62 | 130 | 200 | 52 | 0 | 444 | 150 | 85 | 10 | 245 |