Spirit-Frontier merger:
Competitive network analysis
Mar/Apr 2022

Following on from the strategic review of the planned Frontier Spirit merger, this analysis by Skailark focuses on the all-important detail, quantifying how the merger will impact individual route competitiveness.
Approach
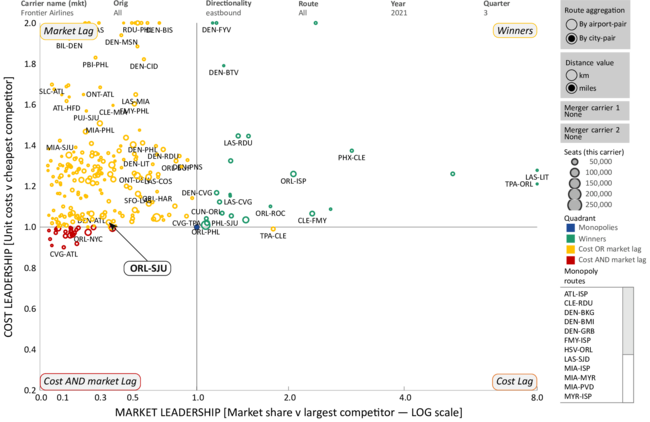
The three images have been taken from skailark’s route competitiveness dashboard: Frontier’s route network, Spirit’s route network and the combined airline.
First, let’s understand the dashboard layout: the x-axis represents market positioning — Relative Market Share or RMS (which is presented on a logarithmic scale). For the selected carrier, this measures the market share against its strongest competitor on each route, by number of seats.
If RMS > 1, the selected airline is the leader in that market. The higher the RMS, the wider the market share gap to the second largest competitor on the route. If RMS < 1, there is another competitor with a higher share of seats on that route. The lower the RMS, the wider the market share gap to the largest competitor on the route. Research and management experience have shown that a high RMS (being a leader) on a route strongly correlates with the profitability on that route, with enhanced ability to control prices and offer more options to customers.
The y-axis represents cost positioning — Relative Cost Competitiveness or RCC) The unit cost (CASM or CASK) of the selected carrier is benchmarked against the lowest cost competitor on the route, using the actual unit costs of the aircraft type (s) flown on each route.
If RCC >1, the selected airline is the cost leader in that market. The higher the RCC, the wider the cost gap to the second lowest cost competitor in that market. If RCC<1, there is another airline competing with lower cost on that route. The lower the RCC, the wider the cost gap to the lowest cost competitor on the route. Again here, a high RCC correlates strongly with profitability in that market.
The top right quadrant (green) displays routes where the respective carrier has both cost and market leadership. The bottom left quadrant (red) highlights routes, where the carrier has neither cost nor market leadership. On routes allocated to the top left and bottom right quadrants (yellow), the airline has either cost or market leadership, not both. Monopoly routes are listed on the bottom right of the dashboard and normalised to 1 (blue dot in the centre).
All data is based on Q3 2021 and the output is shown by city-pair, segment-based. (Note: to view the name of every route with additional information, please refer to the interactive dashboard at https://tinyurl.com/skailark.)
Output and findings
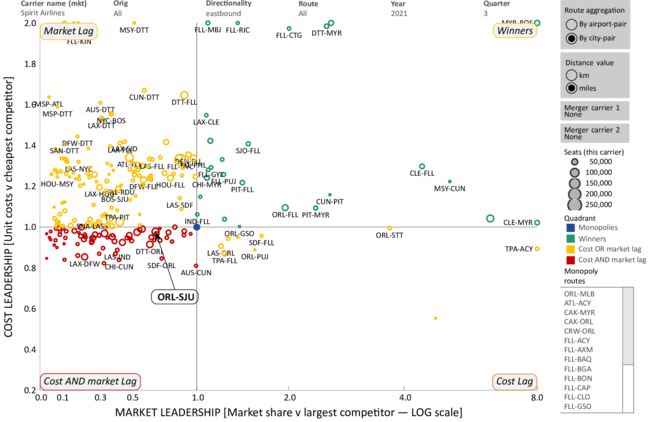
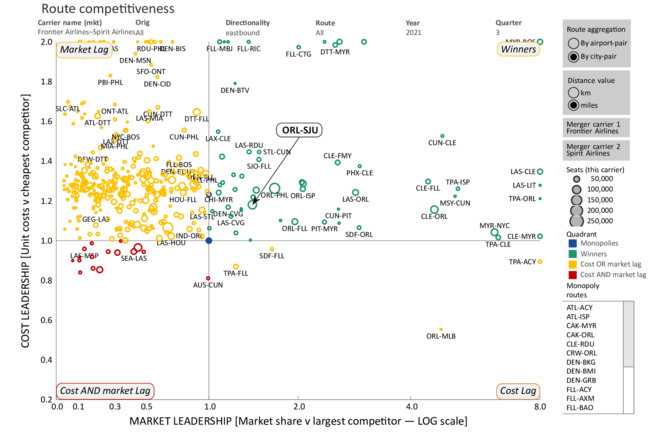
Image 1 divides the network of Frontier (pre-merger) into the four quadrants, while image 2 displays the network of Spirit airlines (pre-merger). Image 3 displays the two carriers combined, modelling a theoretical merged network and assuming no network adjustments.
Let’s pick one example to clarify the output: the city-pair Orlando to San Juan, Puerto Rico (ORL-SJU), which is operated by both airlines. This route is leisure focused so the market share has a lower impact on overall route profitability, but it still nicely illustrates the strategic network impact of the merger.
For Frontier (Image 1) the route ORL-SJU sits in in the top-left quadrant (share lag), meaning Frontier operates with lowest unit costs on the route, while there is another carrier with a higher market share. The left side of Table 1 shows the details, revealing that Southwest is the carrier with the largest number of seats on this route pre-merger.
For Spirit (Image 2) ORL-SJU sits in the bottom-left quadrant (share and cost lag), meaning Spirit operates with slightly higher unit costs compared to Frontier and also that there is another competitor with more seats in this market (again it is Southwest — see Table 1 for confirmation).
In Image 3, representing the Frontier-Spirit merger, the ORL-SJU circle has moved to the top-right quadrant (winning routes and costs — RMS> 1, RCC >1). The reason is that the newly formed Spirit-Frontier carrier surpasses Southwest as the largest carrier with the most seats on the route, and it also has the lowest unit costs. The circle is also larger, as it combines the total number of seats for Spirit and Frontier on the route. The right-hand side of Table 1 shows the details post-merger. In summary, the newly formed merger will have cost and market leadership on that route.
This analysis is automatically computed by skailark for every single route and provides an overall picture of the effect of the planned merger. Table 2 summarises the total share of city-pairs in each quadrant, pre- and post-merger. The highlighted fields are of the most interest. Pre-merger about 10% of routes were in the “winning” quadrant, while post-merger, they rise to 13%, meaning that the combination increases the number of routes with highest market share and lowest cost by about 30%. Equally interesting is the opposite part of the spectrum: the percentage of routes in the bottom-left quadrant (cost and share lag) is significantly reduced from 17% to 3%. This is driven by the elimination of competition between the two carriers. Finally, the number of monopoly city-pairs increases, but only slightly from 11 to 13%. This might be relevant from a regulatory perspective.
The bottom line
The networks of Spirit and Frontier can be classified as largely independent with only limited overlap. The network combination will rather expand the carriers’ reach to more customers across the continent. Nonetheless, on those routes where both carriers are competing today, the joint offering results in market advantages, and is likely to drive higher returns. In general, most overlapping routes shift from the bottom-left towards the top-right highlighting the strategic network synergies. At the same time, other carriers operating on those routes should anticipate the increased competition and could consider strategic adjustments. Furthermore, the number of newly formed monopoly city-pairs is quite low, an angle that is likely to be reviewed by regulators. Of course, this assessment has its limits as it does not consider the O&D-view. However, this is less relevant to an ULCC business model which focuses on point-to-point operations.
skailark
The analysis is available for every airline and network to help management understand the impact of any merger (eg JetBlue-Spirit) on their own network — available with a few simple clicks. Obviously, all airlines aim to have most routes in the top-right quadrant (market and cost leadership) and least in the bottom-left quadrant (market and cost laggers). Even airlines with relatively high unit costs can identify their sweet spot on each route depending on the aircraft deployed by their competitors and the related unit costs. The founders of skailark welcome any feedback from Aviation Strategy readers. Live demonstrations of the dashboards can be arranged.
| Pre-merger | Post-merger | |||||||||
| Route: | ORL-SJU | Route: | ORL-SJU | |||||||
| RMS: | 0.7 | RMS: | 1.4 | |||||||
| RCC: | 0.9777 | RCC: | 1.088 | |||||||
| Seats | CASM | CESM | Seats | CASM | CESM | |||||
| Frontier | 32A | 1,644 | 9.3 | 9.1 | JetBlue | 32A | 3,672 | 13.0 | 10.7 | |
| Airlines | 32B | 8,280 | 8.4 | 8.4 | Airways | 320 | 56,346 | 12.7 | 10.9 | |
| 32N | 23,808 | 9.3 | 9.3 | E90 | 9,200 | 18.9 | 16.6 | |||
| 320 | 900 | 9.6 | 9.3 | Total | 69,218 | 13.5 | 11.6 | |||
| Total | 34,632 | 9.1 | 9.1 | Southwest | 7MB | 5,075 | 10.1 | 8.4 | ||
| JetBlue | 32A | 3,672 | 13.0 | 10.7 | Airlines | 7S8 | 79,625 | 9.9 | 9.2 | |
| Airways | 320 | 56,346 | 12.7 | 10.9 | 73H | 6,125 | 10.0 | 9.3 | ||
| E90 | 9,200 | 18.9 | 16.6 | 73W | 6,435 | 10.9 | 10.5 | |||
| Total | 69,218 | 13.5 | 11.6 | Total | 97,260 | 10.0 | 9.3 | |||
| Southwest | 7MB | 5,075 | 10.1 | 8.4 | Spirit | 32A | 24,030 | 9.7 | 9.5 | |
| Airlines | 7S8 | 79,625 | 9.9 | 9.2 | Airlines-- | 32B | 40,200 | 8.7 | 8.6 | |
| 73H | 6,125 | 10.0 | 9.3 | Frontier | 32N | 26,174 | 9.3 | 9.3 | ||
| 73W | 6,435 | 10.9 | 10.5 | Airlines | 319 | 145 | 10.1 | 9.4 | ||
| Total | 97,260 | 10.0 | 9.3 | 320 | 8,908 | 10.0 | 9.8 | |||
| Spirit | 32A | 22,386 | 9.8 | 9.6 | Total | 99,457 | 9.2 | 9.1 | ||
| Airlines | 32B | 31,920 | 8.7 | 8.7 | ||||||
| 32N | 2,366 | 9.4 | 9.2 | |||||||
| 319 | 145 | 10.1 | 9.4 | |||||||
| 320 | 8,008 | 10.1 | 9.9 | |||||||
| Total | 64,825 | 9.3 | 9.1 | |||||||
| Winners | Cost lag | Share lag | Cost, share lag | Monopolies | ||
|---|---|---|---|---|---|---|
| Pre merger | Frontier (Image 1) | 9% | 0% | 75% | 9% | 6% |
| Spirit (Image 2) | 10% | 3% | 46% | 26% | 15% | |
| Average | 10% | 2% | 61% | 17% | 11% | |
| Post merger | Frontier-Spirit (Image 3) | 13% | 1% | 70% | 3% | 13% |