Outlook for engines
September 1999

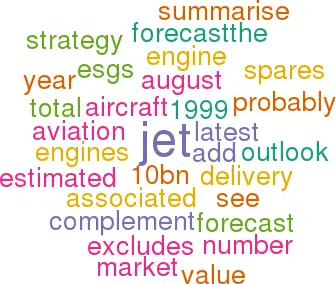
To complement ESG’s latest jet aircraft forecast (see Aviation Strategy, August 1999) here we summarise the associated jet engine delivery forecast.
The total value of the market is estimated at about $10bn this year, but this number excludes spares, which would probably add a further 15%.
| P&W | GE | Rolls | CFM | IAE | Allied | BMW | Allison | TOTAL | |
| Royce | Int. | Signal | |||||||
| 1998 | 245 | 415 | 174 | 838 | 224 | 80 | - | 120 | 2,096 |
| 1999 | 344 | 374 | 204 | 980 | 198 | 100 | 24 | 160 | 2,384 |
| 2000 | 228 | 310 | 148 | 930 | 204 | 60 | 60 | 160 | 2,100 |
| 2001 | 208 | 266 | 130 | 740 | 160 | 40 | 40 | 140 | 1,724 |
| 2002 | 230 | 234 | 160 | 622 | 140 | 40 | 40 | 100 | 1,566 |
| 2003 | 252 | 248 | 180 | 562 | 128 | 40 | 40 | 80 | 1,530 |
| 2004 | 272 | 244 | 196 | 594 | 124 | 40 | 60 | 60 | 1,590 |
| Source: ESG, August 1999. | |||||||||
| $m | ESG VALUE OF ENGINES DELIVERED FORECAST | ||||||||
| P&W | GE | Rolls | CFM | IAE | Allied | BMW | Allison | TOTAL | |
| Royce | Int. | Signal | |||||||
| 1998 | 1,602 | 2,134 | 1,112 | 2,985 | 833 | 116 | - | 211 | 8,992 |
| 1999 | 2,005 | 1,918 | 1,403 | 3,587 | 740 | 146 | 70 | 284 | 10,154 |
| 2000 | 1,371 | 1,500 | 1,057 | 3,487 | 774 | 89 | 177 | 287 | 8,743 |
| 2001 | 1,267 | 1,259 | 976 | 2,826 | 613 | 60 | 120 | 254 | 7,375 |
| 2002 | 1,253 | 1,196 | 1,104 | 2,391 | 548 | 60 | 121 | 184 | 6,859 |
| 2003 | 1,452 | 1,292 | 1,236 | 2,210 | 512 | 61 | 122 | 148 | 7,034 |
| 2004 | 1,565 | 1,374 | 1,336 | 2,360 | 505 | 62 | 185 | 113 | 7,499 |