British Airways: misunderstood but correct?
September 1999


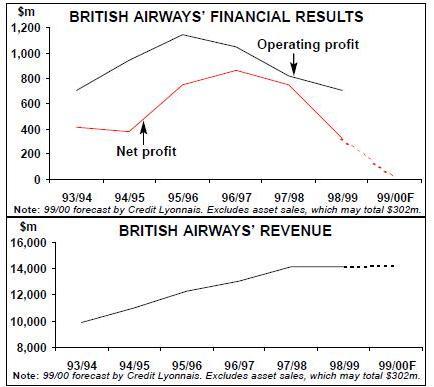
British Airways is in a slightly embarrassing situation. Its latest results indicate that its profitability is not only well below that of Ryanair in relative terms but is also lower in absolute terms. It is possible that BA will not break even this financial year while Air France could produce as a record profit of around $300m. So does the airline’s widely hyped but little understood strategy make sense?
Contra-cyclical cost-cutting
In the 1995/96 financial year BA reported annual net profits of £473m. This put BA in the top tier of the world’s most profitable airlines, or as the airline modestly stated in its annual report, “our financial results continue to set the standards for the industry”. Despite this, in the same year, it launched its Business Efficiency Programme (BEP), which announced the need to “identify and deliver £1bn of annual efficiency savings by March 2000”.
For an airline with a total cost base at the time of about £8bn, this was greeted enthusiastically by both the financial community and institutional shareholders, if not by the employees of the airline. As we approach the end of the BEP, the airline is forecast to just break even or perhaps to report a loss for the current financial year that ends on March 31, 2000. Where have all the efficiency savings gone? Why have they not been translated into increased profitability?
Measuring “efficiency savings” at any complicated business such as an airline is hard, but at every AGM BA is happy to update its shareholders with the latest news on the BEP. A headline number is usually announced and examples given of where savings have been achieved. The following examples are from the 1996/97 financial year:
- BA Regional staff to take pay cuts;
- 400 job losses at BA World Cargo over two years following increased automation;
- Two–year wage freeze and changed working practices for ramp and baggage staff;
- Outsourcing of catering, vehicle management and maintenance services at Heathrow and Gatwick; and
- Closure of the third party handling business at Heathrow.
Estimating BA’s cost savings
As it is well–nigh impossible to quantify the BEP from BA’s accounts we have looked at the question from this angle. Working from the 1994/95, the year before the BEP was introduced, we have recalculated BA’s operating costs for the following four years as if its unit costs (per ATK) had remained the same as in 1994/95. These theoretical costs were then subtracted from the actual reported costs.
The results for 1998/99 and the four completed years of the BEP are shown in the table on the left. This gives an indication of the maximum real savings that have been achieved (some unit costs will fall naturally with overall capacity expansion; on the other hand, inflation has not been taken into account).
The answer would appear to be about £700m of savings so far under the BEP (after discounting the exceptional cost item BA allocated to BEP restructuring in 1996/97). Importantly, the large majority of these savings came through in the last financial year — without them BA’s figures would not have been disappointing, they would have been disastrous.
- The single most important area of cost saving was labour. Although overall staff numbers have increased, labour unit costs have come down as a result of the pay freezes painfully negotiated in 1997, the replacement of high–cost employees with newcomers, and, very importantly, an increase in capacity in 1998. Union conflict and strikes in 1997 may have resulted in bad publicity and deterioration in morale, but in cost control terms the action was essential.
- Landing fees and en route charges are largely outside BA’s control, but this is one area where there would appear to have been significant cost savings. This is perhaps surprising as Eurocontrol prices have been escalating in recent years. On the other hand, landing fees have been reduced thanks largely to the RPI–x pricing formula that BAA has to apply at Heathrow and Gatwick.
- Rationalisation of the sales network — a gradual move to electronic means of production accounts for the reduction in selling costs.
- Aircraft depreciation/operating unit costs have benefited from higher aircraft utilisation, which rose from 8 hours a day in 1994/95 to 8.5 hours last year.
- Handling charges and catering costs have been cut through outsourcing and the subsidiary sales.
- Trends in fuel prices have delighted all airlines over the past five years. BA’s own per gallon costs fell by 3–4% p.a. on average, more if dollar depreciation is taken into account. In addition, as BA is constantly renewing its fleet, savings in fuel burn to the order of roughly 3% p.a. should have been achieved. Unfortunately, it is difficult to detect this efficiency improvement in BA’s numbers, probably because of the large increase in delays caused by air traffic control.
- Even in Engineering, where costs have risen, BA claimed to be making efficiency gains through outsourcing (of IT, for example). It is possible that some of the labour cost savings noted above reappear as purchases of external services in this category.
- The final category, which lumps together a disparate range of costs, looks to have been increasing alarmingly over the period of the BEP.
However, much of this rise is associated with the impact of the appreciation of sterling on the cost structure, a development that is certainly outside management control.
Unfortunately, costs are only one part of the equation when it comes to the calculation of airline profitability. The BEP was put into effect recognising that yields were likely to fall in real terms and in anticipation of some form of cyclical downturn in the industry. However, a recession did not materialise; rather competition increased both from UK low–cost new entrants and from the revitalised Lufthansa and Air France and their alliance partners. It is interesting to speculate about what would have happened if there had been a Europewide aviation downturn: there might now be another wide gap between the performance of BA and its continental rivals, who have not yet begun to address competition, cost and efficiency questions in the same way as BA.
In retrospect though, either the cost saving targets in the BEP were too low, the yield assumptions too high, or more likely a combination of both. It should be remember that in 1997 BA’s senior management was faced with an unenviable task explaining to the staff and unions the need for the BEP at a time when the airline was producing good profits. Having achieved the staff’s “buy–in”, albeit reluctantly, setting stiffer targets has proved a step too far.
The downsizing strategy
After five years of continuous cuts the easy savings will have been made. Aside from possibly Engineering and Flight Training, there are no large business units that can be outsourced, and most of the non–core activities have long since been sold. Now the plan is to shrink the airline. Capacity growth in the current financial year to end–March 2000 will be just 0.6% and the following three years will see up to a 12% reduction in capacity.
The downsizing strategy will have one inevitable effect — it will push up BA’s unit costs unless there is another attack on fixed and semi–fixed costs. Hence BA’s immediate response in announcing (to the British Sunday press rather to its unions) a policy of cutting a further £225m out of its cost base by decimating its middle management through redundancies of more than 1,000.
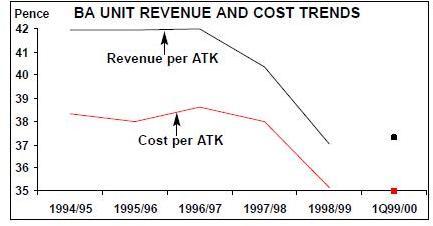
Factoring in the planned reduction in ATKs, another £250m cost base reduction from the BEP and the new £225m additional cost cut, the cost per ATK for BA circa 2002 will be 37.7 pence/ATK, a rise of about 7% from the current level. Current unit revenue is only 37.0 pence, and to return to 1995/96 profit levels BA needs a unit revenue of around 42 pence.
So, on the basis of this crude calculation, we estimate that BA’s target over the next two or three years has to be to push up unit revenue by 13%, through a combination of better load factors and higher yields. To achieve this, the airline is implementing a package of strategies — fleet downsizing, concentration on point–to–point, route rationalisation and new brands.
Fleet policy
A couple of years ago, BA was at the forefront of the airlines pressing Airbus to build the A3XX “super jumbo”. However, the long–haul fleet in the future will now be increasingly centred on the 777 rather than the 747. BA has 19 orders and 16 options for the 777, having cancelled all nine orders for the 747. The 777’s First and Business cabins are configured in much the same way as the 747s, so the seats are all being squeezed out of the Economy cabin.
There are interesting developments in the narrow–bodied fleet. BA has been pursuing a policy of phasing out 737 aircraft from Heathrow and using the 757 as its prime short–haul workhorse. The remaining 737s were either to be sold, used at its smaller UK hubs (Gatwick, Manchester and Birmingham), or be handed on to the airlines’ subsidiaries.
However, this appears to have radically changed. The Heathrow 757 fleet is now perceived as offering too much capacity, so the 39 A319s and 20 A320s that BA has on firm order will eventually replace these aircraft. In turn, the 737 fleet must also be replaced as 737–200s are only Chapter 2–compliant, and the -300s and — 400s are now too large for the new strategy. BA is reported to be talking to Airbus and Boeing about acquiring 100–seater replacements. Unfortunately for Airbus and BA, the A318 delivery positions would appear to be too far out in time to permit BA to carry out its plans. Fortunately for Boeing, it can meet BA’s demands with the 717. BA now has to decide whether it is worth the high cost of introducing a new type to its fleet in order to satisfy the strategic planners. BA will be looking to some innovative ideas from both manufacturers to solve the dilemma.
Route rationalisation
BA seems determined to prune its route structure, signalling its intentions by, for example, dropping Pittsburgh. It is also in the process of a three–month review of all its European services.
Assuming that the basic problem with the rationalised routes is revenue rather then operating cost, this strategy is the logical one to pursue. The downside — allowing competitors into Heathrow to operate the abandoned routes — is limited now that there will be no liberalisation of Bermuda 2 in the near future. Indeed, BA’s shift towards smaller capacity jets could be seen as a way of mopping up as many slots as are available at this congested airport — from the BAA’s point of view the new strategy can hardly be regarded as a optimal use of scarce resources.
In Europe, there is a strong possibility that many of the leisure–orientated routes will be outsourced to Go, in the process increasing BA’s presence at Stansted. This, in turn, may increase pressure for an IPO of Go; as long as it could retain a significant stake BA might welcome this development as it would diffuse some of criticism that Go is being subsidised by the parent and it would provide BA with a welcome infusion of funds.
Market segmentation
BA has four basic passenger segments: premium point–to–point, premium transfer, economy point–to–point and economy transfer. BA’s aim is to change the revenue mix by concentrating on premium traffic, but it’s really only the fourth category that BA wants to eliminate completely — the very low yielding economy transfer passengers. In effect, BA is attempted to redraw the competitive boundaries to those that it understands — operating in a duopoly against known competitors on major point–to–point routes.
The risk is that by focusing so much on point to- point business travel, BA is increasingly exposing the company fully to the vagaries of the UK business cycle. If the UK economy, which is never in sync with the German and French economies, slumps, the BA’s profitability will depend on the second category — premium transfer. Then it will have to try to win this traffic back from the continental alliances.
By squeezing the number of economy seats, BA may run into another yield problem. If BA succeeds in filling the front cabins with business travellers, it may find that an unacceptably large proportion of the back cabin is occupied by business travellers redeeming their FFP miles and contribution zero yield.
Then there is also the classic segmentation problem: a business traveller is also likely to be at another time a leisure traveller. If BA inadvertently alienates the leisure–travelling business traveller, it will lose high yield custom.
Super-branding
To succeed in pushing up unit revenue BA has to extract premium prices through its new unique long–haul brand which feature both a super–First and a super–Business product (to be followed by a super–Economy product?).
BA has probably established a potential lead here. But it is not the only airline making product improvements at the top end of the market: Singapore Airlines and Cathay Pacific already offer bed seats and Virgin is similarly committed to their introduction.
The emphasis on promoting its own product brands again raise questions about the oneworld concept. Although it is certainly not going to disappear, oneworld as a brand is greatly weakened as AA/BA (see Aviation Strategy passim) is on perpetual hold and will only be resurrected when the UK and the US agree on some form of open skies. Nevertheless, the oneworld alliance still brings certain major strategic or tactical benefits to BA — the Bangkok hub with Qantas is very important in accessing Southeast Asia; Hong Kong with Cathay is the unquestioned gateway to China, Madrid with Iberia is potentially very important for South America; Helsinki with Finnair is useful for Northeast Asia.
In Europe, the question is whether the benefits that DBA and Air Liberte bring in terms of promoting oneworld compensate for the losses they continually report. Although selling these subsidiaries would be in line with the downsizing strategy, it is unlikely that BA would be willing to see Lufthansa, Air France or KLM encroach on its territory even if that territory is not presently producing any profits.
There are no European precedents to judge BA’s package of strategies by, although it they are not too different from those pursued by the US Majors in recent years — severely restrain capacity, force up yields, fortify hubs, upgrade international products, outsource to lower–cost subsidiaries — which has produced record profits. But in the US all the main airlines were playing the same game.
| 1998/99 | Four-year total | |
|---|---|---|
| Employee costs | 304 | 422 |
| Landing fees and en route charges | 131 | 255 |
| Selling costs | 223 | 253 |
| Depreciation and operating leases | 58 | 243 |
| Handling charges, catering & other op. costs | 34 | 131 |
| Fuel and oil | 167 | 54 |
| Engineering and other aircraft costs | -50 | -110 |
| Accommodation, ground equipment costs | ||
| and currency effects | -109 | -421 |
| Total operating cost savings | 757 | 827 |
| BEP restructuring cost | -127 | |
| NET SAVINGS | 700 |
| Current fleet | Orders | Delivery/retirement schedule/notes | |
|---|---|---|---|
| 737-200 | 18 | 0 | |
| 737-300 | 7 | 0 | |
| 737-400 | 34 | 0 | |
| 747-100 | 6 | 0 | |
| 747-200 | 16 | 0 | |
| 747-400 | 57 | 0 | |
| 757-200 | 53 | 0 | |
| 767-300 | 28 | 0 | |
| 777 | 25 | 19 (16) | For delivery in 2000-2002 |
| A319 | 0 | 39 | Delivery in 1999-2004 |
| A320 | 10 | 20 (129) | Delivery in 1999-2004. Options are |
| Concorde | 7 | 0 | for A320 family |
| DHC-7-100 | 2 | 0 | |
| DHC-8 | 17 | 0 | |
| TOTAL | 280 | 78 (145) |

