Can the cavernous supply/demand gap be managed?
October 2001

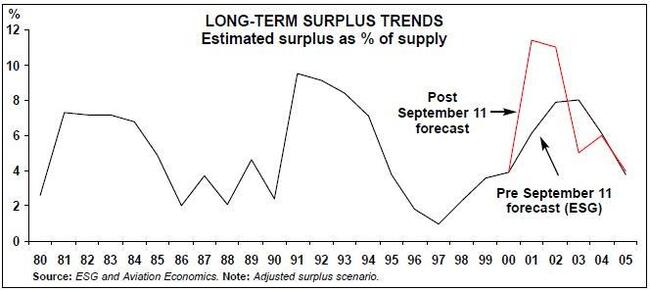
The demand numbers are disturbing enough, but factoring in the supply side reveals a market that is now totally out of balance. To avoid the emergence of a surplus of jet aircraft more than twice as large as that of the early 90s, the manufacturers will have to take drastic action.
First of all, the methodology: in order to arrive at an estimate of aircraft demand, the forecast RPK totals are converted into ASKs using 2000 load factors (representative of a balanced market). These ASKs are then converted into average jet units by dividing by average utilisation (as in 2000), speed and average seats. This can be regarded as measure of demand for jets in a balanced market.
So, based on our traffic predictions, the industry is facing a cumulative fall in demand of over 700 units during 2001/02 (see table above). At the same time, some 2,400 new jets have been or are scheduled for delivery during this period (note that the delivery estimates take account of the cutbacks already announced by the manufacturers). Estimated "normal" deletions would total just over 600.
As a consequence, the theoretical surplus soars from an estimated 600 units at the end of last year to a theoretical 2,900 at the end of 2002. This is equivalent to 18% of supply, and is frankly inconceivable (in 1991 the surplus was 9%).
To get back to a 11% surplus, which is still pretty bad, somehow 1,200 units have to be taken out of the market.
Increased scrapping is probable, but past experience suggests that market imbalance is never neatly resolved by a massive scrapping of old types. Nevertheless, perhaps an additional 400 or so of elderly 727s, 737- 200s, 747–200s and DC–9s could assigned to the aluminium smelters in addition to the normal scrapping rate.
This then leaves about 800 units due to be delivered up to the end of 2002 which will have to be cancelled or more likely deferred (the final column in the table above shows deliveries to operators being postponed to 2003 and 2004).
The implication is a 45% decrease in output, much greater that that mooted by the manufacturers. Boeing is talking about a 25% decline in planned output in 2002; Embraer is contemplating a 35% cutback; Airbus, remarkably, is sticking to a 10% reduction from forecast 2002 output.
It may be enlightening to look at the delivery schedule in more detail — see page 6. The obvious observation is that US carriers, both Majors and regional affiliates, dominate the picture, accounting for 16 of the top 20 operators due to take new aircraft in the period up to the end of 2002. Given their parlous condition, how many aircraft do the manufacturers really expect them to take in the short term? Southwest, the healthiest by some way of the US Majors, is currently refusing to take 11 737s due for hand–over this year. Nor can the manufacturers take much comfort from many of the European carriers which too will postpone deliveries and even go bankrupt.
There will be plenty of surplus secondhand aircraft for the still aggressive low–cost carriers like Ryanair to mop up without turning to the manufacturers (it has has 600 offers in response to its advert for 50 737s).
The Regional Jet phenomenon will certainly be slowed but there is the possibility that they will benefit from a downsizing trend from 150–seater types to RJs.
The lessors, notably ILFC and GECAS, also have substantial delivery positions (91 units), and even before September 11 there was speculation about their ability to negotiate deferred deliveries if the recession deepened. Now it is difficult to see how the lessors can take these scheduled deliveries in the short term; they have their own problems — up to the end of 2002 they face about 130 aircraft scheduled to come off lease before dealing with the inevitable distressed returns.
So, while most of the attention so far has focused on the plight of airlines, the manufacturers and lessors could well be facing an equally difficult time. In fact, their adjustment process may be more complicated as the production lines cannot be just shut down then suddenly ramped up to record production rates to meet the expected demand rebound in 2003 or whenever.
| Change in aircraft | Scheduled deliveries* | Balance | Theoretical | As % of | Adjusted | Required | |||||
| demand | Boeing | Airbus | RJs | Total | Deletions | change** | surplus*** | supply | surplus | changes**** | |
| 2000 | 600 | 4% | |||||||||
| 2001 | -311 | 440 | 350 | 330 | 1,120 | -270 | 1,161 | 1,761 | 11% | 11% | |
| 2002 | -414 | 410 | 350 | 300 | 1,060 | -300 | 1,174 | 2,936 | 18% | 11% | -1,200 |
| 2003 | 2,157 | 410 | 350 | 380 | 1,140 | -330 | -1,347 | 1,588 | 9% | 5% | 400 |
| 2004 | 967 | 410 | 350 | 400 | 1,160 | -370 | -177 | 1,411 | 8% | 6% | 400 |
| 2005 | 1,020 | 410 | 350 | 400 | 1,160 | -420 | -280 | 1,131 | 6% | 4% | |
| CRJ | Emb Do BAE | RJs | 717 | 737 | 747 | 757 | 767 | 777 | Boeing | A600 | A320 | A330 | A340 Airbus | TOTAL | ||||
| Continental Exp. | 68 | 68 | 0 | 0 | 68 | |||||||||||||
| United | 0 | 1 | 8 | 9 | 59 | 59 | 68 | |||||||||||
| American | 0 | 29 | 17 | 4 | 10 | 60 | 0 | 60 | ||||||||||
| Atlantic Coast | 26 | 33 | 59 | 0 | 0 | 59 | ||||||||||||
| Continental | 0 | 28 | 13 | 13 | 1 | 55 | 0 | 55 | ||||||||||
| Northwest | 12 | 12 | 2 | 9 | 11 | 30 | 30 | 53 | ||||||||||
| ILFC | 0 | 5 | 1 | 9 | 15 | 30 | 5 | 35 | 50 | |||||||||
| American Eagle | 11 | 34 | 45 | 0 | 0 | 45 | ||||||||||||
| Skywest (US) | 44 | 44 | 0 | 0 | 44 | |||||||||||||
| Delta Air Lines | 0 | 36 | 5 | 1 | 42 | 0 | 42 | |||||||||||
| GECAS | 10 | 10 | 13 | 4 | 17 | 10 | 4 | 14 | 41 | |||||||||
| Comair | 39 | 39 | 0 | 0 | 39 | |||||||||||||
| Southwest | 0 | 39 | 39 | 0 | 39 | |||||||||||||
| ATA | 0 | 29 | 8 | 37 | 0 | 37 | ||||||||||||
| ASE | 32 | 32 | 0 | 0 | 32 | |||||||||||||
| Iberia | 0 | 0 | 27 | 3 | 30 | 30 | ||||||||||||
| Mesa | 10 | 20 | 30 | 0 | 0 | 30 | ||||||||||||
| Express Airlines | 29 | 29 | 0 | 0 | 29 | |||||||||||||
| Air Canada | 0 | 1 | 1 | 26 | 1 | 27 | 28 | |||||||||||
| Air France | 0 | 1 | 7 | 8 | 12 | 7 | 19 | 27 | ||||||||||
| Air Wisconsin | 27 | 27 | 0 | 0 | 27 | |||||||||||||
| SAS | 0 | 8 | 8 | 8 | 1 | 6 | 15 | 23 | ||||||||||
| BA | 0 | 3 | 3 | 19 | 19 | 22 | ||||||||||||
| JetBlue | 0 | 0 | 22 | 22 | 22 | |||||||||||||
| LanChile | 0 | 1 | 1 | 16 | 4 | 20 | 21 | |||||||||||
| Korean Air | 0 | 6 | 6 | 3 | 15 | 5 | 5 | 20 | ||||||||||
| Airtran | 0 | 19 | 19 | 0 | 19 | |||||||||||||
| UPS | 0 | 0 | 19 | 19 | 19 | |||||||||||||
| Asiana | 0 | 3 | 7 | 10 | 4 | 4 | 8 | 18 | ||||||||||
| Ana | 0 | 7 | 6 | 13 | 3 | 0 | 3 | 16 | ||||||||||
| Horizon Air | 16 | 16 | 0 | 0 | 16 | |||||||||||||
| Varig | 0 | 8 | 4 | 4 | 16 | 0 | 16 | |||||||||||
| Eurowings | 15 | 15 | 0 | 0 | 15 | |||||||||||||
| Luft Cityline | 15 | 15 | 0 | 0 | 15 | |||||||||||||
| LTU | 0 | 0 | 8 | 6 | 14 | 14 | ||||||||||||
| Pembroke | 0 | 14 | 14 | 0 | 14 | |||||||||||||
| Crossair | 11 | 11 | 0 | 2 | 2 | 13 | ||||||||||||
| Sabena | 0 | 0 | 9 | 4 | 13 | 13 | ||||||||||||
| SIA | 0 | 1 | 12 | 13 | 0 | 13 | ||||||||||||
| Tam | 0 | 0 | 13 | 13 | 13 | |||||||||||||
| Flightlease | 0 | 5 | 5 | 4 | 3 | 7 | 12 | |||||||||||
| Regional | 12 | 12 | 0 | 0 | 12 | |||||||||||||
| Easyjet | 0 | 11 | 11 | 0 | 11 | |||||||||||||
| Frontier | 0 | 0 | 11 | 11 | 11 | |||||||||||||
| Ryanair | 0 | 11 | 11 | 0 | 11 | |||||||||||||
| Virgin Blue | 0 | 11 | 11 | 0 | 11 | |||||||||||||
| Chautauqua | 10 | 10 | 0 | 0 | 10 | |||||||||||||
| China Northern | 0 | 0 | 10 | 10 | 10 | |||||||||||||
| Emirates | 0 | 5 | 5 | 5 | 5 | 10 | ||||||||||||
| Midway | 2 | 2 | 8 | 8 | 0 | 10 | ||||||||||||
| Others* | 38 | 33 | 19 | 5 | 95 | 14 | 106 | 26 | 3 | 7 | 13 | 169 | 0 | 119 | 19 | 17 | 155 | 419 |
| Grand Total | 326 | 188 | 52 | 5 | 571 | 47 | 353 | 40 | 50 | 47 | 89 | 626 | 19 | 442 | 60 | 34 | 555 | 1,752 |
| Source: ACAS | Note: * Orders of less than 10 units | nbsp; | ||||||||||||||||