Global demand outlook
October 2001

Immediately after September 11, the airline industry was completely traumatised — it seemed that demand for air travel had evaporated for ever and that all airlines would have to adapt to a profoundly changed market. This scenario may still prove to be correct, but it is looking increasingly unlikely as time goes on.
The alternative view is that that the industry will recover as it has done in the wake of previous terrorism, Chernobyl and Middle East wars. The closest relevant experience is the Gulf war of 1991, though this time the repercussions are going to be deeper and probably longer. What we are suggesting is that the September 11 impact will be something like double the Gulf war effect rather than the Gulf war effect squared. Of course, if there are further serious air terror attacks, then all bets are off.
So, as a reminder of what happened to traffic ten years ago, we present this table. It’s not a completely clear picture. European airlines took the brunt of the traffic collapse in 1991; international passengers disappeared but then they surged back in 1992. Bizarrely, there was also a boom in intra–European business in 1991 as travel patterns altered and some capacity was redeployed.
US international traffic also went negative in 1991 but the big hit was in the domestic market, as the US economy had entered a serious recession (US GDP was -0.2%). 1992 saw a big rebound in international and a reasonable recovery in domestic.
Asia/Pacific carriers felt the impact of the Gulf war but still maintained marginal international growth, while intra–region traffic continued to soar. Overall, 1991 traffic growth was respectable; 1992 was very good indeed.
The 1992 rebound — 9% globally — restored world traffic growth rates to what they might have been expected to be, absent the Gulf war. Yet behind the global figure were all sorts of regional and structural complications. For instance, the state–owned European carriers were able to buy back traffic without worrying too much about adjusting their cost bases, strategies which had to be supported by state aid packages and painful restructuring plans (with greatly varying degrees on success). The foundations were laid for Air France, to take the most notable example, to build a true hub and spoke system at CDG.
The subsequent fall in operating lease rates and the sudden availability of flying crew and airport space created the conditions for the emergence which the new wave of low cost carriers.
By contrast, in the US the shock of the Gulf war, coinciding with a severe the merger frenzy of the 80s, caused the US Majors to rethink the "boom and bust" trap. The strategies of combining low capacity growth with cost control and strong yield management had their origins in the crisis of the early 90s, and generally worked very well until this year when they were clearly unravelling.
In order to estimate the impact of September 11 on global air traffic development, we have built a mini–model which uses data originally compiled by ESG* from ICAO sources. The idea is that different assumptions about the initial, short term, rebound and medium term traffic rates can be plugged in and regional and global rates will be generated. We intend to use this model to track the development of the market over the following months.
Overall we are showing an unprecedented initial fall in traffic, which follows on from a mostly flat first eight month of the year. We estimate more moderate declines in the first eight months of next year, followed by an upturn in the final four months (remembering that the change in traffic is generated from a very depressed base).
The initial and short term declines estimated for the US industry are in line with those presented by Leo Mullin on behalf of the ATA to Congress of September 19. The effect on European and Asian airlines will be less marked, and domestic operations should be relatively unscathed. The rest of the world shows a steeper decline because Middle East airlines are included in this group.
There is an amazing amount of noise in the market at the moment as airlines are not only suffering genuine distress but also taking this opportunity to restructure radically and present their plight to governments in the most forceful way. Hence, we are not clear as to whether these estimates are optimistic or pessimistic.
We assume that the full rebound takes place in 2003,18–24 months after the disaster impact. The post Gulf war rebound occurred 6–12 months after full–scale conflict in Kuwait and Iraq.
The rebound rates are generated by finding the growth rate that restores European and Asian traffic to the level it would have been expected to be had September 11 not happened. In other words, European and Asian airlines re–capture 100% of lost traffic. For the US we are assuming only a 90% recapture, recognising that some form of structural change in Americans' propensity to fly has occurred.
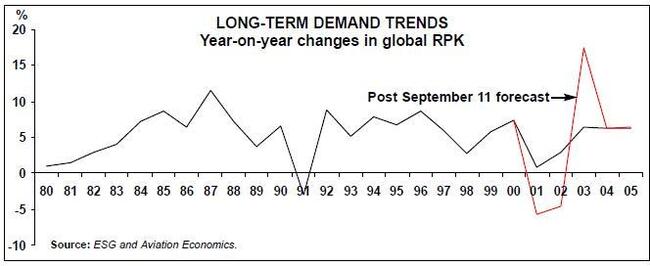
This table above summarises the outlook for regional and global traffic. The industry would appear to be facing two years of global negative growth, 6% this year and 5% next, before the putative 2003 rebound.
Two years of global negative growth is unprecedented though the newly deregulated US industry experienced something similar in 1980–81. Similarly unprecedented is the 17% rebound in 2003 (though the European carriers did achieve 18% internationally in 1992). In reality such an annual total is unlikely as the rebound, assuming it takes place in the way we have predicted, will not fit neatly into a calendar year.
Yet another unknown is how the events of September 11 will affect the economic cycle. In the last issue (how long ago that seems) we were talking about a soft landing for the major economies. Now some form of V–shaped recession seems more likely, with the recovery boosted by government spending and softer monetary policies. This seems consistent with our sharp aviation rebound thesis.
In the next article we look at how all this impacts the global supply and demand balance.
| Average | 1991 | 1992 | Average | |
| INTERNATIONAL | 1981-90 | 1991-00 | ||
| US airlines | 7.1% | -0.9% | 11.0% | 4.3% |
| European airlines | 6.0% | -11.2% | 18.0% | 7.2% |
| Asia/Pacific airlines | 8.1% | 0.3% | 16.3% | 8.3% |
| DOMESTIC/INTRA-REGION | ||||
| US airlines | 5.4% | -2.3% | 4.9% | 4.1% |
| European airlines | 6.8% | 11.1% | 8.6% | 8.5% |
| Asia/Pacific airlines | 7.0% | 13.1% | 8.1% | 7.7% |
| TOTAL | ||||
| US airlines | 5.4% | -1.9% | 6.6% | 4.1% |
| European airlines | 6.1% | -8.5% | 16.7% | 7.4% |
| Asia/Pacific airlines | 7.7% | 4.3% | 13.5% | 8.1% |
| WORLD* | 5.9% | -2.9% | 8.9% | 5.8% |
| US | US | Euro | Euro | Asian | Asian | ROW | ROW | |
| Dom | Int | Dom | Int | Dom | Int | Dom | Int | |
| Initial (Sept-Dec 2001) | -30% | -40% | -10% | -20% | -5% | -10% | -5% | -15% |
| Short term (Jan-Aug 2002) | -10% | -20% | -5% | -10% | -2% | -5% | -3% | -10% |
| Short term Sept-Dec 2002) | 5% | 10% | 5% | 10% | 5% | 5% | 5% | 5% |
| Rebound (2003) | 15% | 20% | 7% | 20% | 15% | 20% | 12% | 20% |
| Medium term average (2004-06) | 4% | 6% | 5% | 6% | 9% | 9% | 5% | 8% |
| US | US | US | Euro | Euro | Euro | Asian | Asian | Asian | World | World | World | |
| Dom | Int | Total | Dom | Int | Total | Dom | Int | Total | Dom | Int | Total | |
| 2000 | 6% | 7% | 6% | 2% | 7% | 7% | 9% | 11% | 11% | 5% | 9% | 7% |
| 2001 | -10% | -12% | -11% | -3% | -6% | -6% | 1% | 0% | 0% | -6% | -5% | -6% |
| 2002 | -6% | -13% | -8% | -2% | -4% | -4% | 0% | -2% | -1% | -4% | -5% | -5% |
| 2003 | 15% | 20% | 16% | 7% | 20% | 18% | 15% | 20% | 18% | 14% | 20% | 17% |
| 2004 | 4% | 6% | 5% | 5% | 6% | 6% | 9% | 9% | 9% | 5% | 7% | 6% |
| 2005 | 4% | 6% | 5% | 5% | 6% | 6% | 9% | 9% | 9% | 5% | 7% | 6% |