Airlines lose up to half their value in two months
October 1998


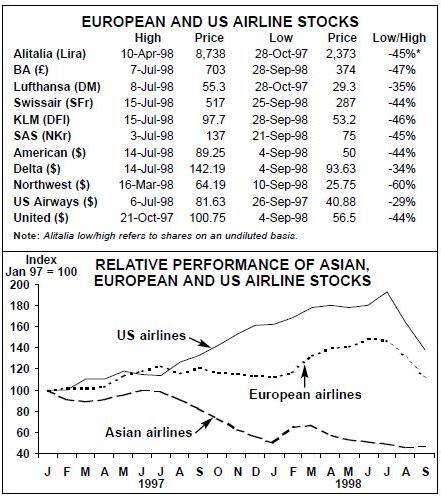
For much of the first half of the year, the stock–markets on both sides of the North Atlantic were charging round in a seemingly endless bull market (see chart, below). Like all good bulls, this one seems to have been chased out of the shop by a big bear, the last bit of china to break being — as it were — the Russian samovar. In this process airline stock prices have been taken on a roller–coaster ride.
With one or two exceptions, the share prices of the major airlines in Europe and the US peaked in July, registering all–time highs in many cases. Two months later they stand some 45% below their peaks (see table below — which may well be out of date by the time Aviation Strategy reaches subscribers because lows may be even lower now).
Of course, this movement should be seen in context of the markets. However, in terms relative to the performance of the local stock market indices, they have also fallen dramatically from the relative peaks. There are of course some exceptions — the prime one being Southwest Airlines, whose shares recently hit another high.
The mini-crash and industry fundamentals
Airline shares are somewhat volatile investments, but what do these recent moves tell us about the industry’s fundamentals? Some of these moves are specific to individual carriers — the strike at Northwest has been disastrous for the mid–west carrier, so the 60% under–performance of their shares in relative and absolute terms may be understandable. Equally the recent tragic crash of one of Swissair’s MD–11s has undermined sentiment towards the holding company’s shares.
However, the airline industry may be seen as one that surfs on the crest of the economic wave, so that with a fear of economic slowdown or recession — either globally or locally — their shares are among the first to be affected.
On industry specifics there are many signs that bear comparison with previous peaks in the airline industry cycle — not least of which is the state of the aircraft order backlog. Capacity is also rising faster than traffic (although by only 2% on international routes to/from the US and by less than 1% on European international flights).
Add to this the continuing bad news coming from Asia (see pages 8–9), Russia and Latin America, and it may be hardly surprising that investors fly to safety. It may not be that the stock–market forecasts a full–blown recession — and it would be a first for the recession not to occur in conjunction with high oil prices — but it may well be that it fears it.
| High | Price | Low | Price | Low/High | |
| Alitalia (Lira) | 10-Apr-98 | 8,738 | 28-Oct-97 2,373 | -45%* | |
| BA (£) | 7-Jul-98 | 703 | 28-Sep-98 | 374 | -47% |
| Lufthansa (DM) | 8-Jul-98 | 55.3 | 28-Oct-97 | 29.3 | -35% |
| Swissair (SFr) | 15-Jul-98 | 517 | 25-Sep-98 | 287 | -44% |
| KLM (DFl) | 15-Jul-98 | 97.7 | 28-Sep-98 | 53.2 | -46% |
| SAS (NKr) | 3-Jul-98 | 137 | 21-Sep-98 | 75 | -45% |
| American ($) | 14-Jul-98 | 89.25 | 4-Sep-98 | 50 | -44% |
| Delta ($) | 14-Jul-98 | 142.19 | 4-Sep-98 93.63 | -34% | |
| Northwest ($) | 16-Mar-98 | 64.19 | 10-Sep-98 25.75 | -60% | |
| US Airways ($) | 6-Jul-98 | 81.63 | 26-Sep-97 | 40.88 | -29% |
| United ($) | 21-Oct-97 | 100.75 | 4-Sep-98 | 56.5 | -44% |