Cycles in perspective
December 2007


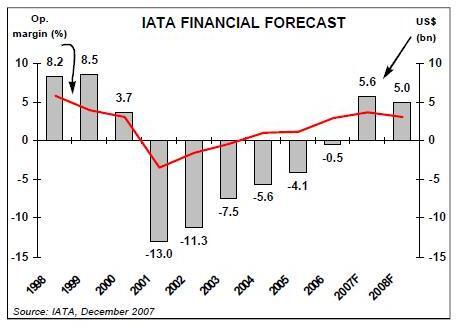
Crunching credit and soaring fuel is clearly not a good combination for the aviation industry. Citing these adverse developments, IATA has come out with a forecast that sees a cyclical downturn in 2008 and identifies 2007 as the peak of the market.
This means, using IATA’s definition of the cycle in terms of global net profit/loss, that the recent upturn is very truncated. However, it is becoming more difficult to interpret the significance of an agglomerated forecast in an aviation world that is becoming less and less homogenous.
One of the features of the aviation scene in recent years has been the contrast between the US network carrier sector — which has been characterised by low growth, drawn–out labour negotiations and downsizing by the Legacy carriers, with minimal investment in new equipment — and the rest of the developed world. This is a huge generalisation of course, but in Europe the main network carriers are all enjoying success with variations on the global hub strategy, the Middle East super–connectors remain overwhelmingly ambitious, and SIA is pioneering the A380. Even the US LCC sector, despite the continued solid performance of Southwest and the innovative alliance strategies of JetBlue, has not been anywhere near as dynamic as Europe, where Ryanair continues to produce excellent financial results, expand its network and continuously minimalise the short haul product, to the dismay of some, to the delight of others.
It is disturbing that IATA reckons that the North America region’s net profit will fall from an estimated $2.7bn in 2007 to $2.2bn in 2008 (this decline accounts for almost all of the forecast global downturn). This certainly goes against the perception that some of the Legacies are now in a strong position to reap benefits from their Chapter 11 restructurings.
Then IATA is projecting a paltry $2bn net profit for Europe. But the four network carriers' (Air France/KLM, BA, Lufthansa and Iberia) combined net profits for next year are currently being forecast by equity analysts at around $6.5bn while the big two LCCs — Ryanair and easyJet — will add a further $1.1bn or so. One wonders who is going to make the counterbalancing massive losses — Alitalia can’t do it all on its own.
The US/rest of the world split is also reflected in apparently contrasting views of the state of the aircraft market. In the US many leading airline executives and financiers attribute the lack of profitability in the Legacy sector to systemic overcapacity and plead the case for mergers to rationalise the business. In Europe and particularly in the emergent aviation markets of the Middle East, India and China, there is a widespread view of the aircraft market as being under–supplied relative to demand, which has resulted in lease rates for modern narrowbodies doubling over the past five years, a strong escalation in second–hand prices and excessively long waiting periods for deliveries of new orders. From this perspective, a cyclical peak probably has been reached, and a slowdown would even be beneficial in taking some of the heat out of the market.
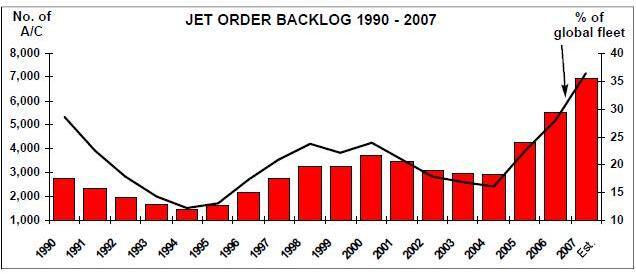
There is no sign of a slowdown in ordering activity as yet; indeed, 2007 looks to have been another record year with 2,348 firm orders booked by Airbus and Boeing (in the ratio 47/53). This compares to 1,834 last year and 2,057 in 2005, which was confidently identified as the peak of the ordering cycle.
LCCs from all continents, leasing companies and the super–connectors — notably Emirates — were the main players, though US Airways did firm up a significant re–fleeting programme.
| A320 | ||||||
| family | A330 A340 A350 A380 Total | |||||
| Aegean Airlines | 6 | 6 | ||||
| Aercap | 10 | 10 | ||||
| Aeroflot | 5 | 22 | 27 | |||
| Aircastle Advisor Ltd | 15 | 15 | ||||
| Air France | 2 | 2 | ||||
| Avion Aircraft Trading | 8 | 8 | ||||
| BAA Jet Management | 1 | 1 | ||||
| British Airways | 4 | 4 | ||||
| Comlux Aviation | 2 | 2 | ||||
| CSA Czech Airlines | 8 | 8 | ||||
| easyJet | 35 | 35 | ||||
| Finnair | 7 | 11 | 18 | |||
| Iberia | 3 | 3 | ||||
| Israir | 3 | 3 | ||||
| KLM | 2 | 2 | ||||
| Lufthansa | 30 | 30 | ||||
| MNG Airlines | 2 | 2 | ||||
| S7 Group | 25 | 25 | ||||
| SWISS | 2 | 9 | 11 | |||
| TAP Air Portugal | 12 | 12 | ||||
| Ural Airlines | 7 | 7 | ||||
| Uzbekistan Airways | 6 | 6 | ||||
| Vista Jet | 3 | 3 | ||||
| Wizz Air | 50 | 50 | ||||
| European Total | 187 | 46 | 10 | 45 | 2 | 290 |
| Aviation Capital Group | 45 | 45 | ||||
| CIT Leasing | 25 | 5 | 2 | 32 | ||
| GECAS | 60 | 60 | ||||
| Guggenheim | 6 | 6 | ||||
| ILFC | 20 | 20 | ||||
| Intrepid Aviation | 20 | 20 | ||||
| Jet Alliance | 2 | 2 | ||||
| Petters | 6 | 6 | ||||
| Spirit Airlines | 30 | 30 | ||||
| US Airways | 60 | 15 | 22 | 97 | ||
| N.American Total | 228 | 41 | 5 | 44 | 0 | 318 |
| Air Caraibes | 2 | 2 | ||||
| Avianca | 20 | 10 | 30 | |||
| LAN Airlines | 15 | 15 | ||||
| Volaris | 14 | 14 | ||||
| L. American Total | 49 | 12 | 0 | 0 | 0 | 61 |
| Air Asia | 50 | 50 | ||||
| Air Blue | 8 | 8 | ||||
| C Jet | 1 | 1 | ||||
| Cebu Pacific | 10 | 10 | ||||
| Fly Asian Xpress | 15 | 15 | ||||
| Flyington Freighters | 12 | 12 | ||||
| Go Air | 3 | 3 | ||||
| Hong Kong Airlines | 31 | 20 | 51 | |||
| Mandala Airlines | 25 | 25 | ||||
| Singapore Airlines | 20 | 20 | ||||
| Thai Airways | 8 | 8 | ||||
| Tiger Airways | 20 | 20 | ||||
| Asian Total | 148 | 55 | 0 | 20 | 0 | 223 |
| Afriqiyah Airways | 5 | 5 | ||||
| Air Arabia | 34 | 34 | ||||
| ALAFCO | 7 | 12 | 19 | |||
| Al Jaber Group | 2 | 2 | ||||
| Egyptair | 5 | 5 | ||||
| Emirates | 70 | 15 | 85 | |||
| Etihad | 8 | 4 | 12 | |||
| Jazeera Airways | 30 | 30 | ||||
| Kingdom Holding | 1 | 1 | ||||
| Middle East Airlines | 2 | 2 | ||||
| National Air Services | 20 | 20 | ||||
| Nouvelair | 2 | 2 | ||||
| Oman Air | 5 | 5 | ||||
| RAF Oman | 2 | 2 | ||||
| Qatar Airways | 2 | 80 | 3 | 85 | ||
| Yemenia | 10 | 10 | ||||
| Africa/M.East Total | 106 | 18 | 4 | 172 | 19 | 319 |
| Private Customer | 8 | 1 | 4 | 13 | ||
| Unidentified Total | 0 | 0 | ||||
| Gross Total | 726 | 173 | 23 | 281 | 21 | 1224 |
| 737 | ||||||
| NG | 747 | 767 777 787 Total | ||||
| Aeroflot | 22 | 22 | ||||
| Aerosvit | 7 | 7 | ||||
| Air Berlin | 25 | 25 | ||||
| Air France | 9 | 9 | ||||
| AWAS | 31 | 31 | ||||
| Azerbaijan Airlines | 2 | 3 | 5 | |||
| British Airways | 4 | 4 | ||||
| Cargolux Airlines | 3 | 3 | ||||
| DHL International | 6 | 6 | ||||
| First Choice Airways | 4 | 4 | ||||
| KLM Royal Dutch | 13 | 4 | 17 | |||
| LOT Polish Airlines | 1 | 1 | ||||
| Norwegian Air Shuttle | 42 | 42 | ||||
| Ryanair | 27 | 27 | ||||
| S7 Group | 15 | 15 | ||||
| SAS | 2 | 2 | ||||
| SkyEurope | 5 | 5 | ||||
| Transavia Airlines | 7 | 7 | ||||
| Travel Service | 1 | 1 | ||||
| Uzbekistan Airways | 2 | 2 | ||||
| Virgin Atlantic | 15 | 15 | ||||
| European Total 136 | 3 | 6 | 17 | 88 | 250 | |
| Air Canada | 23 | 23 | ||||
| AirTran | 15 | 15 | ||||
| Alaska Airlines | 5 | 5 | ||||
| American Airlines | 1 | 1 | ||||
| Aviation Capital Group | 30 | 5 | 35 | |||
| Babcock & Brown | 20 | 20 | ||||
| Boeing Business Jet | 16 | 1 | 3 | 20 | ||
| CIT Leasing Corp. | 5 | 5 | 10 | |||
| Continental Airlines | 4 | 5 | 9 | |||
| Delta Air Lines | 1 | 1 | ||||
| GECAS | 53 | 6 | 59 | |||
| Guggenheim Av. Partners | 3 | 3 | ||||
| ILFC | 10 | 1 | 52 | 63 | ||
| Oak Hill Capital Partners | 8 | 8 | ||||
| Pegasus Airlines | 6 | 6 | ||||
| Southwest | 28 | 28 | ||||
| UPS | 27 | 27 | ||||
| WestJet | 20 | 20 | ||||
| N.American Total 213 | 1 | 27 | 19 | 93 | 353 | |
| Copa Airlines | 4 | 4 | ||||
| LAN Airlines | 3 | 2 | 26 | 31 | ||
| TAM | 8 | 8 | ||||
| L. American Total | 4 | 0 | 3 | 10 | 26 | 43 |
| Air New Zealand | 4 | 4 | 8 | |||
| All Nippon Airways | 4 | 4 | ||||
| Cathay Pacific | 10 | 12 | 22 | |||
| China Southern Airlines | 55 | 6 | 61 | |||
| JAL International | 5 | 5 | ||||
| Jet Airways | 20 | 3 | 23 | |||
| Lion Air | 88 | 88 | ||||
| Nippon Cargo Airlines | 6 | 6 | ||||
| Philippine Airlines | 4 | 4 | ||||
| Sky Peace Ltd. | 1 | 1 | ||||
| SpiceJet | 10 | 10 | ||||
| Virgin Australia | 6 | 6 | ||||
| Virgin Blue | 10 | 10 | ||||
| Xiamen Airlines | 25 | 25 | ||||
| Asian Total 208 | 16 | 0 | 39 | 10 | 273 | |
| ALAFCO | 6 | 16 | 22 | |||
| Arik Air | 10 | 5 | 7 | 22 | ||
| Emirates | 12 | 12 | ||||
| LCAL | 6 | 6 | ||||
| Qatar Airways | 5 | 30 | 35 | |||
| Royal Jordanian | 4 | 4 | ||||
| Africa/M.East Total | 16 | 0 | 0 | 22 | 63 | 101 |
| Unidentified Total | 62 | 20 | 12 | 94 | ||
| Gross Total 639 | 20 | 36 | 127 | 292 | 1114 | |
| Changes | -4 | -4 | -2 | -10 | ||
| 2007 Net Total 635 | 16 | 36 | 125 | 292 | 1104 | |

