Finnair: The Niche
Vanishes
Jul/Aug 2025

Pre-pandemic, Finnair had a nice niche position among European airlines. A small, regional airline based in the far north east of the continent, and in a small country of a mere 5.5m inhabitants, Finnair was nevertheless able to market services through its hub in Helsinki as providing the shortest and fastest connecting flights between Europe and the Far East.
Situated on the great circle route between points in the US and India, it had the potential to access sixth freedom traffic between, for example, New York and Delhi.
Operating out of a small, single terminal, three-runway airport that could provide one of the shortest minimum connecting times in Europe, it did so efficiently and profitably.
Finnair is a well-run airline and manoeuvred its way through the two years of the pandemic, creditably raising €500m each in equity and debt plus €300m from asset sales net of capital expenditure. At the same time it pursued a cost savings programme to remove €200m annual running costs. While its traffic base virtually disappeared and annual revenues were only 27% of those achieved in 2019, it lost a total €(1.1)bn on €1.7bn of revenues over the two years to end 2021.
At the beginning of 2022, signs of recovery were in the air; and Finnair’s then CEO Topi Manner felt comfortable enough to announce the opening of new long haul routes to Dallas, Seattle, Boston and Tokyo Haneda and predict by “next summer we will be closer to a normal operating environment”.
But then, two weeks after the publication of that 2021 annual report, Russia invaded Ukraine. This led quickly to the closure of Russian airspace to European airlines at the beginning of March 2022.
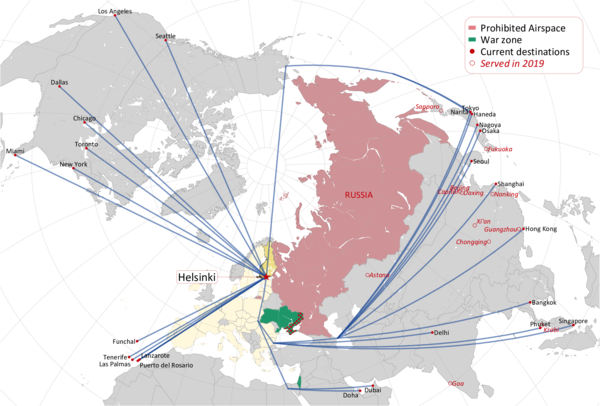
For Finnair, this was disastrous for what it considered its core market connecting passengers from northern Europe to North Asia through Helsinki and flying over Siberia. In 2019, for example, its route from Helsinki to Tokyo, a great circle distance of 7,850km, would have taken 9h-9h30 to fly — allowing it to be able to have a single aircraft to complete the return trip within 24 hours. Detours to avoid Russian airspace involve flying north over the Pole or south, avoiding Ukraine, over Turkey and Kazakhstan: the choice depending on weather conditions. This adds nearly 4,000km and over four hours to the trip time.
| Helsinki to | Distance* (km) | Diverted | Δ |
|---|---|---|---|
| Tokyo | 7,849 | 11,100† | 41% |
| 11,750‡ | 50% | ||
| Seoul | 7,050 | 10,600 | 50% |
| Delhi | 5,229 | 7,000 | 34% |
| Singapore | 9,271 | 11,100 | 20% |
| Hong Kong | 7,820 | 10,500 | 34% |
| Shanghai | 7,408 | 10,600 | 43% |
The map highlights the impact using an equidistant azimuthal map projection based on Helsinki — an effect that is impossible to show on the traditional Mercator projection.
Strategic Reset
The company’s Asian routes had been among the most profitable in the Network, but Finnair recognised that its unique geographic competitive advantage that made them so had disappeared overnight. The immediate reaction was to cancel most of its Japanese routes — pre-pandemic of all the European airlines Finnair had had the highest volume of flights to the largest number of destinations (Tokyo, Nagoya, Osaka, Fukuoka, and Sapporo) in Japan. It continued to operate to Tokyo, Seoul and Shanghai, despite the lengthy detours — routes supported, it said, by strong cargo demand. Southeast Asian operations were to some extent less impacted by the airspace closure and Finnair continued operations to Delhi, Bangkok and Singapore almost as normal.
It could have decided to shrink back to being purely a regional point-to-point airline serving the local Finnish needs. But it had invested heavily in developing its long haul fleet of A330s and A350s — and there was the hope that at some point it would regain the right to access Russian airspace.
In September 2022 it announced its new strategy designed to restore Finnair’s profitability “regardless of Russian airspace”.
Key to the new strategy was an understanding that the markets now available to Finnair are generally less regulated, with few barriers to entry, and highly competitive; low costs would be critical to be able to operate profitably. The main areas of the strategy were “a geographically more balanced network, leveraging the use of partners — especially those in oneworld — strengthening of unit revenues, reduction of unit costs and sustainability”. It targeted a 5% operating margin (last achieved in 2019) by 2024.
Finnair was one of the first to join the oneworld alliance in 1998, and benefits from membership within the key anti-trust-immune joint ventures: the Atlantic Joint Business (alongside American, British Airways and Iberia) and the Siberian Joint Business (beside British Airways, Iberia and JAL).
It disposed of a handful of A321s and entered into wet-lease agreements with British Airways and Eurowings for other narrowbody equipment to avoid grounding idle aircraft and furlough crew. It also leased some of the A330 fleet to Qantas, and operated routes on behalf of and in cooperation with Qatar using the other six between the three Nordic capitals and Doha.
Results for 2024 showed revenues had almost recovered to the levels achieved in 2019, and Finnair just managed to achieve the targeted 5% operating margin.
A Difficult 2025
Finnair this year has been beset by industrial action. The company started intense negotiations with its pilots’ union in August 2024. During the process the pilots initiated industrial action measures, implementing overtime bans, work-to-rule and restrictions on reserve recruitment that impacted the airline’s operational flexibility. It also angered Qatar and Qantas. It did not help that ground staff went on strike in the summer. Both disputes have been solved with medium term collective agreements. But the Qatar terminated its cooperation agreement on the six A330s effective February, and Qantas seems to be moving to dry-lease its two from October.
For the first half of the year Finnair reported revenues were slightly up year on year at €1.48bn, but operating profits of €25m in the first half of 2024 slumped to an operating loss of €34m for the same period this year.
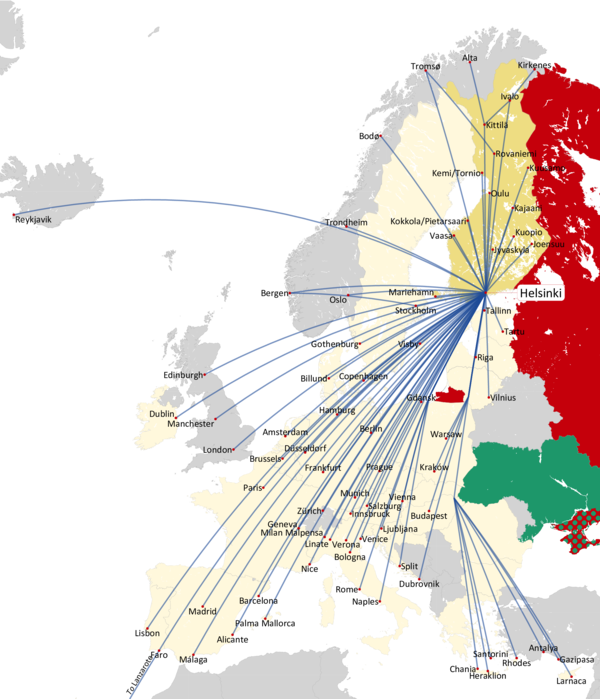
Finnair again had a surplus of long haul aircraft and this year has significantly increased capacity to American’s hubs in North America. It has added two weekly rotations to to Chicago to provide a daily service, the same for Los Angeles to make five flights a week; and it has added five to Dallas giving 11 flights a week. It has also reopened services to Toronto for the first time in a decade.
| Passengers (000s) | ASK‡ (m) | RPK‡ (m) | ||||||||||||
|---|---|---|---|---|---|---|---|---|---|---|---|---|---|---|
| 2025† | y/y %ch | 2019 | v '19 | 2025† | y/y %ch | 2019 | v '19 | 2025† | y/y %ch | 2019 | v '19 | |||
| Europe | 7,806 | 5% | 9,151 | -15% | 16,746 | 6% | 17,364 | -4% | 12,565 | 5% | 14,024 | -10% | ||
| North America | 470 | 17% | 457 | 3% | 4,875 | 19% | 4,068 | 20% | 3,639 | 17% | 3,470 | 5% | ||
| Middle East | 320 | -32% | 113 | 183% | 1,870 | -36% | 530 | 253% | 1,437 | -32% | 448 | 221% | ||
| Asia | 1,478 | 12% | 2,556 | -42% | 14,068 | 5% | 23,304 | -40% | 11,328 | 12% | 19,329 | -41% | ||
| Finland | 1,740 | 4% | 2,374 | -27% | 1,609 | 7% | 1,923 | -16% | 1,051 | 3% | 1,262 | -17% | ||
| Total | 11,814 | 5% | 14,650 | -19% | 39,167 | 4% | 47,188 | -17% | 30,021 | 6% | 38,534 | -22% | ||
Notes: † twelve months to August; ‡ based on great circle distances.
For the twelve months to end August, Finnair’s capacity on the Atlantic was up 20% year on year (and 20% higher than in 2019), but its load factors were 10 points lower than pre-pandemic at 74.7%.
Despite the problems with Russian airspace Finnair also added services to Japan, Osaka in particular.
Finnair has not tried to recover a meaningful position in China. Pre-pandemic it had operated to seven airports in the PRC — a larger number of destinations served than any other European airline. But its main competitors, the Chinese carriers, are not barred from flying over Russia.
Return to prebellum status?
Should Finnair continue to hope that it can return to the prebellum position?
For years after the Winter War of 1939 (which Finland sort of won) and during the Cold War there had been a relative peace on the 1,340km border between it and Russia. While other European cariers periodically had difficulty then to access Russian airspace, Finland, treated as a “neutral” nation seemed to enjoy almost privileged access.
However, Finland has now joined NATO, and Russia no longer regards the country as neutral. A settlement to the war in Ukraine would be one of the prerequisites for Russia to start relaxing restrictions, let alone dismantling of sanctions against it. Russia would no doubt require reciprocal access to European airspace — and Europe will be worried about allowing in Russian aircraft (of Western design) that have spent years without officially documented maintenance.
Perhaps, sadly, Finnair needs to abandon ambitions and accept that it needs to shrink back to a point-to-point regional airline based in the far north east of the European peninsula.
| seats | In Service | Age | On Order | |
|---|---|---|---|---|
| A319ceo | 144 | 5 | 24.2 | |
| A320ceo | 174 | 10 | 23.1 | |
| A321ceo | 209 | 15 | 11.0 | |
| A330 | 279 | 8 | 15.9 | |
| A350 | 278-321 | 18 | 7.5 | 1 |
| E190† | 100 | 12 | 17.2 | |
| ATR72† | 68-70 | 12 | 16.2 | |
| Total | 80 | 14.8 | 1 |
|
|
