Garuda Indonesia: Financial troubles
follow quantum leap
Jul/Aug 2017

With a significant fall in profits in 2016 and a drop into the red for the first-half of 2017, Garuda Indonesia is facing troubled times. A new CEO has just 12 months to turn around Indonesia’s flag carrier; what are the chances of succeeding?
Founded back in 1947, today Garuda Indonesia offers services to 61 domestic and 73 international destinations around the globe and is one of the Asia/Pacific region’s major airlines. In 2016 the Garuda group saw revenue rise 1.3% to US$3.9bn (the company reports its results in US dollars), based on a 6.2% rise in group passengers carried, to 35m. However, operating profits fell 41.3% to $99.1m, and the net profit was down 88% compared with 2015, to just $9.4m.
The trend continued into this year. In the first half of 2017 the Garuda group saw revenue rise by 7%, to $1,886.5m, of which $1,636m came from scheduled passenger revenue (up 4.6% year-on-year), with passengers carried up 3.9% to 17.2m. But an operating loss of $37.8m in H1 2016 increased to a $214.5m operating loss in January-June 2017, and a net loss of $63.2m in the first half of 2016 grew to become a $283.8m net loss in H1 2017.
The first half figures for the full-service Garuda Indonesia mainline are discouraging — the majority of passengers (5.0m out of the total mainline total of 6.1m) were carried on domestic Garuda services, where passenger yield dropped 3.8% year-on-year, to 7.9US¢ — whereas costs/ASK rose 3.8% in the half, to 7.1¢. The data show the same adverse trends for international services at the mainline (1.1 m passengers in H1 2017), where passenger yield fell 5.5% to 6.0¢, and CASK rose 3.1% to 5.4¢.
Other than the mainline, the Garuda group has six major business units/subsidiaries, the most important of which is Citilink, the group’s LCC. Launched in 2001 and based in Jakarta (as is the mainline), it operates a fleet of 57 aircraft to more than 30 destinations domestically and across the Asia/Pacific region. Citilink carried 5.6m passengers in H1 2017 (up 7.8% year-on-year), but costs per ASK rose even faster here than at the mainline — up 10.5% to 4.8¢. Even after stripping out fuel, CASK rose 6.5% in January-June 2017, to 3.1¢. The only bright news in a sea of red KPIs for the group was a 5.8% rise in yield for Citilink in H1 2017, to 5.1¢. Overall though, despite Citilink reporting a 19.6% rise in revenue in H1 2017, to $264.8m, its net loss worsened by a huge 139.5%, to $51m.
Pahala Nugraha Mansury, a former banker, became president & CEO of Garuda Indonesia in April this year (replacing Arif Wibowo, who lasted just over two years), with a warning/mandate from Rini Soemarno, Indonesia’s state-owned enterprises minister, that the airline needs “a thorough restructuring in both operations and finances”.
The new leadership can’t blame the rise in costs so far this year purely on fuel — though it accounts for just over 27% of all operating costs, and fuel costs rose by 36.5% in H1 2017 compared with the first half of 2016. That’s because every other category of major costs rose at the group, with — for example — “general administration” costs rising by a massive 60% to $183m in H1 2017.
Expansion mania
It’s difficult to unpick the limited amount of data available in Garuda’s public accounts, but the underlying driver of rising costs is a combination of poor management control and the group’s unrelenting focus on expansion. Passengers carried have risen from just 6m in 2006 to 35m in 2016 (a compound growth rate of 14.5% pa), with the fleet quadrupling over the same period and fuelled by its so-called “Quantum Leap” strategy that was launched in 2009 with the aim of transforming Garuda from an essentially moribund airline into a modern-day carrier.
The problem that Garuda made for itself after this initial phase, was that it continued to believe that growth was the panacea for all its problems. Under the previous chief executive, Wibowo (who started in December 2014), the group’s “Sky Beyond” strategy targeted a domestic market share of 50%, an international share of 50% and achievement of more than $10bn in turnover annually by the early 2020s. To do that a fleet of well over 300 aircraft was envisaged; in short, the mantra for Garuda — yet again — was expansion.
However, that ambition was severely dented by the reduced profitability through 2016, leading to furious attempts to cut costs as Wibowo tried to avoid the group posting losses — which ultimately was to no avail.
Mansury now has the task to halt and reverse the group’s downturn, but that will be hard to do given that the airline still seems intent on aggressive growth in order to keep expanding its market share. Many of the group’s international routes are believed to be unprofitable (particularly to Europe), yet the company keeps expanding internationally (no doubt encouraged by its majority shareholder — the government) in an attempt to develop Jakarta as a major transit hub against multiple local rivals.
Jakarta’s Soekarno–Hatta International airport — 20km north-east of the capital — is relatively young (opening domestically in 1985 and internationally in 1991), but is now operating at full capacity, with its three terminals and two runways carrying some 59m passengers in 2016. A third runway is under construction, although it won’t be completed until 2018, and while a fourth terminal is unlikely before 2022, an upgraded Terminal 3 will be completed this year.
In the meantime, Garuda’s expansion continues apace. In January-May 2017 Garuda’s international passengers carried rose by 24.1% — way ahead of almost all other legacy competitors in the Asia/Pacific market (passengers carried in the total Asia/Pacific market rose 5.8% in the same period).
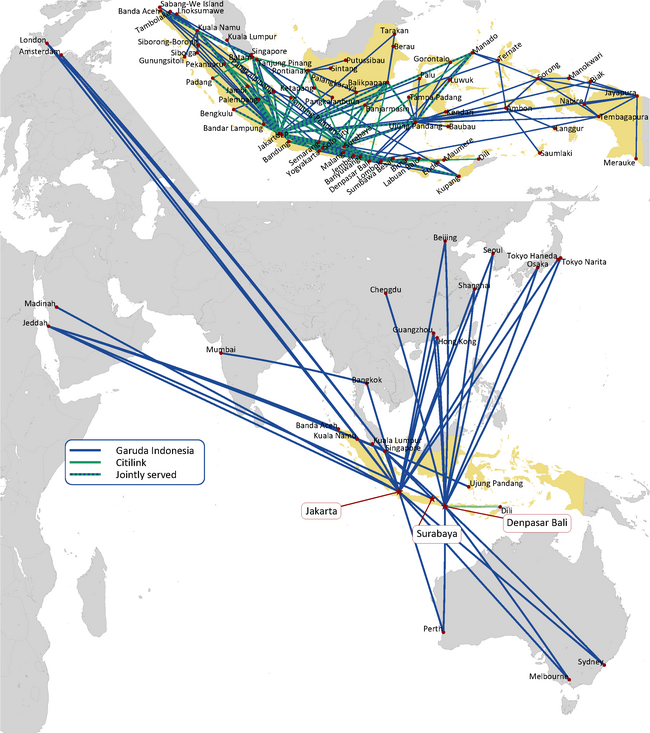
Garuda’s international network now covers Asia (36 destinations), Africa (two), the US (Chicago, Los Angeles, New York, San Francisco and Seattle), Middle East (seven) and Europe (23). Most of these are code shares, and it only actually operates to 17 Asia/Pacific destinations outside Indonesia, London and Amsterdam in Europe, and two in the Middle East (see map). Services from Bali to Chengdu — the group’s fourth Chinese destination — started in June this year while a Jakarta-Moscow service using A330-200s was announced to launch in August and a Jakarta to Los Angeles via Tokyo route is scheduled to start in November with 777-300ERs.
Garuda Indonesia joined SkyTeam in March 2014 and has a total of 27 codeshare partners (the latest of which is Saudia, which started in August), though interestingly throughout its expansion strategy, while capacity has risen steadily (see chart), the airline has struggled to lift passenger load factor above the mid-70s.
To be fair to management, the expansion focus is partly being driven by the relentless wave of competition from LCCs. AirAsia Indonesia (see Aviation Strategy, June 2017) operates out of three hubs in Indonesia — Jakarta, Surabaya and Medan. The biggest challenge, however, comes from Lion Air, which launched in 1999 and today operates out of the same three hub airports as AirAsia with a fleet of 109 737s and three A330s.
Lion Air’s services connect more than 100 destinations domestically (where it has the largest market share, ahead of Garuda) and throughout Asia, and scarily (from Garuda’s point of view) it has an outstanding order book for 203 737 MAXs and 737-900ERs.
By its own estimate Garuda had a 39.5% share of the domestic market in the first half of 2017 (down from 40.6% in H1 2016) and a 28.0% share of the international market (compared with 27.1% in January-June 2016), and the airline seems to be obsessed with increasing those percentages.
Variable cost efforts
Garuda has been and is carrying out cost-cutting exercises, which in 2016 concentrated on items such as fleet optimisation, reduced insurance costs and optimised maintenance programmes, aimed at on saving US$250m on an annual basis.
However, progress has been mixed; for example, productivity in terms of ASKs per airline employee has improved steadily over the last few years (see chart). On the other hand, fleet rationalisation is painfully slow. The Garuda groups currently operates a fleet of 200, but this is split between 11 different types.
The mainline operates 73 737-800s, 18 CRJ-1000s, 16 ATR 7-600s, two 747-400s, 10 777-300ERS, seven A330-200s and 17 A330-300s. To make matters worse even the LCC — Citilink — operates four types: five 737-300s, three 737-500s, 45 A320-200s and four A320-200neos. In short, the fleet strategy is a mess.
By the end of this year the total fleet will increase to 202 aircraft but the mix will change only slightly, with the two 747-400s exiting at the mainline. However, by the end of 2017 the total number of models won’t reduce as one new type will be added, with mainline receiving the first of an outstanding order for 50 737MAX-8s (placed in 2014), which will all be delivered by 2023.
Citilink also has an outstanding order for 25 A320neos and the mainline for six more of the model. Additionally, Garuda has an order for 14 A330-900s, placed last year, which will start arriving in 2019.
Other measures that are being implemented include adding an extra 79 seats for each 777-300ER aircraft, and a renegotiation of all contracts with manufacturers and lessors. Of the total fleet of 200, all but 22 are leased, though so far Garuda has only managed to renegotiate existing contracts with a single lessor.
In terms of revenue generation, although ancillary revenue is rising there are other areas where Garuda is significantly behind its rivals (whether legacy or LCCs); for example, 51% of all its ticket sales originate from travel agencies, with the Garuda’s ticket offices accounting for another 23% and just 24% coming from e-commerce sources.
Mansury’s challenge
Mansury says that “the phase of business cycle that Garuda Indonesia is going through is only temporary” — which may be wishful thinking given that upon his appointment Soemarno warned that “we give him 12 months” to turn the airline around,
The airline is “taking action” to improve revenue, with a better balance of ASK versus RPK growth, and improving passenger yield — although at the same time is says it wants to continue to increase market share both domestically and internationally. That seems an impossible mix, not least because Mansury will be spending a lot of his time trying to keep shareholders on board, negotiating with more than 25 lessors to reduce leasing costs, and smoothing concern among creditors and the stock market in general.
The Indonesian state still owns 60.5% of the airline, with 24.6% owned by PT Trans Airways (an executive charter airline owned by Indonesian businessman Chairul Tanjung), with the group listing on the Jakarta stock exchange in February 2011. Since then, however, the share price has fluctuated wildly (see chart) — rising well above the Rp700 level in 2013 before plunging to almost touch Rp300 in 2015. After a recovery in early 2016 the price has fallen sharply over the last 12 months, and the stock has underperformed around 85% of Indonesia-listed stocks over the period. Today the price is hovering just under the Rp350 level, and it will have to rise significantly over the next few quarters if Mansury wants to retain his job.
Shareholders will be nervous by the 9.3% rise in financial debt at Garuda in just six months — total debt stood at $1.9bn as at the end of June 2017, and net gearing rose from 1.1x as at December 31st 2016 to 2.1x on June 30th 2017. More worryingly perhaps, cash fell by 29.2% year-on-year, to $381m at the end of June 2017, which management blames largely on “the significant growth of operating expenses”.
Whichever way you look at it, Mansury has a very tough job ahead, and unless he can effectively reign back expansion in order to give the airline breathing space to cut costs, the group is more than likely to have yet another CEO in place sometime in 2018.
| Group Total | 187 | 196 | 202 | (95) | |
| In service | |||||
|---|---|---|---|---|---|
| 2015 | 2016 | 2017e | (On order) | ||
| Garuda | 747-400 | 2 | 2 | ||
| 777-300 | 9 | 10 | 10 | (1) | |
| A330-200 | 9 | 7 | 7 | ||
| A330-300 | 13 | 17 | 17 | ||
| A330-900 | (14) | ||||
| Widebody | 33 | 36 | 34 | (15) | |
| 737-800 | 81 | 75 | 73 | ||
| 737MAX-8 | 1 | (49) | |||
| CRJ 1000 | 18 | 18 | 18 | (2) | |
| ATR72 | 11 | 15 | 18 | ||
| Narrowbody | 110 | 108 | 110 | (51) | |
| Total | 143 | 144 | 144 | (64) | |
| Citilink | 737-300 | 5 | 5 | 5 | |
| 737-500 | 3 | 3 | 3 | ||
| A320ceo | 36 | 44 | 50 | ||
| A320neo | 4 | (31) | |||
| Total | 44 | 52 | 58 | (31) | |
Notes: Garuda includes Citilink, Lionair includes Batiq and Wings, Others = All other carriers operating domestically or to/from Indonesia