Virgin Australia = (Velocity + Domestic)
— (International + Tiger)
December 2019


Virgin Australia, Australia’s second airline, has been pursuing for the past ten years the aim of establishing itself as a genuinely effective competitor to Qantas. It hasn’t found this journey particularly profitable.
Since the global financial crisis, the airline industry has enjoyed a strong uptrend and reasonable levels of profits on a global basis, but Virgin Australia has managed to lose a total of A$2bn (US$1.5bn) at the net level since 2012.
Even at the operating level, only its domestic operations and its loyalty programme have produced positive results: its low cost subsidiary Tigerair Australia, and the international operations have been heavily loss-making.
Weak results
In March, the architect of the plan to move the airline to a multi-brand platform, CEO John Borghetti, was replaced by Paul Scurrah (formerly DP World Australia, Queensland Rail and Ansett). His first set of results, the full year figures for the year to end June, do not make encouraging reading. The group produced operating profits of A$90m (down by two-thirds from the prior year period) on revenues of A$5.8bn (up by 7%). This was on the back of a modest 2% growth in passenger numbers (to 25.5m) and 5.3% increase in capacity in ASK terms.
After writing off the remaining goodwill attached to Virgin Australia International (A$48m) and Tigerair Australia (A$105m), and applying restructuring charges of A$234m the Group reported a statutory net losses of A$315m, halved from 2018’s A$653m.
Operating profit in the domestic operation nearly halved to A$133m, representing a margin of 3.4%. But Tigerair Australia increased its operating loss by a quarter to A$45m, equivalent to 8% of revenues, and the international operations plummeted further into the red with an operating loss of A$76m (5.8% negative margin) compared with loss of A$13m in the prior year.
The one bit of good news was that the group’s frequent flier programme, Velocity, reported impressive growth — in loyalty programme participation, to 9.8m members (45% of Australia’s population), in revenues (up by 10% to A$411m) and operating profits (up by 10% to A$122m) giving an operating margin of 30%.
At least this is what we believe might have happened. The Group has a habit each year of restating prior year results making it difficult to analyse consistent trends.
Restructuring essential
The new CEO’s first task has been the inevitable restructuring programme. On the day he took office he emphasised that returning to profitability — not winning market share against Qantas — is his priority.
And his problem is highlighted by the company’s own figures. Virgin Australia Domestic achieved an ex-fuel unit cost in the year to end June of 8.9A¢/ASK, 6% higher than that at Qantas Domestic, but yields per RPK were 22% and unit revenues per ASK 20% lower than those of the market leader.
There are two traditional strategems in the industry to achieve the goal of widening the gap between unit revenues and unit costs: to try to grow rapidly into unit cost savings hoping that unit revenues will not fall as fast; or the far harder task to try to shrink to improve unit revenues and battle to cut out unnecessary costs.
Following an initial review, he announced that he is taking the second option. Head office will lose 750 positions by the end of 2020 (a third of the administrative complement) to save an annual A$75m. The airline has 40 737MAX on order, originally destined for delivery to start in November 2019. He has delayed introduction of its first 737MAX10 until 2021 and the first 737MAX8 to 2025, while converting 15 of the 737MAX8s orders to 737MAX10s. In addition he announced a target annual saving of A$50m from a renegotiation of supplier contracts.
At the same time he brought in an all new top management team and announced plans for a new simplified organisational structure to unwind the legacy complexities developed by his predecessor.
In November the group further announced a significant series of culls of loss-making routes, including Melbourne to Hong Kong and Sydney to Christchurch, reducing the group’s network capacity by 2 per cent.
“I think it’s the start of the way we’re going to do business", says Scurrah, “We won’t fly everywhere and particularity won’t fly where it’s not profitable to do so”.
And yet, Virgin Australia is still willing to open new international routes, the area where it has been bleeding money. The group recently hauled in Richard Branson for a publicity stunt on a baggage carousel on the announcement of its new Tokyo Haneda route granted in time for next year’s Tokyo Olympics (even though airlines rarely make anything but publicity from flying during an Olympic season to the host country). The group has a trans-Pacific ATI joint venture with Delta, and recently signed a deep cooperation agreement with Virgin Atlantic (covering joint pricing, inventory management, scheduling coordination, network planning and marketing) for the kangaroo route through either Hong Kong or Los Angeles.
Velocity buyback
However, to pile on the financial pressure, private equity group Affinity (the minority shareholder in Velocity) announced its desire to sell its stake. Virgin Australia was virtually forced to buy back in the 35% interest it did not own for around A$700m. To do so it is raising US$425m and A$325m in unsecured loan notes at an 8% interest rate. Part of these funds will be used to repay an existing A$570m loan that became due in November.
The result of this move will be to wipe out what little shareholders' equity remained on the balance sheet. In the table we show the proforma impact of the fund raising and acquisition of the minority stake. Long term debt would increase by nearly A$1bn to A$3.2bn, net current cash would increase a little, the minority interest of A$29m would disappear, but the balancing item of the acquisition would come out of reserves. This would produce a negative shareholders' equity of A$(111)m. However, the group claims that the acquisition is expected to generate synergies of A$20m at the EBIT level.
It is worth noting that Virgin Australia has yet to adopt IFRS/AASB16 (which brings operating leases on to the balance sheet — see "No accounting for leases", Aviation Strategy April 2016), although it is doing so in the current financial year to end June 2020. We attempt to show the proforma impact on the June 2019 balance sheet. The group has guided that the accounting change could add A$1.1-1.3bn to the fixed assets as “Right-of-use assets” but that the debt portion of the capitalised leases could increase long term liabilities by between A$1.85 and A$2.05bn, maintenance portion a further A$350-A$450m and various other liabilities of A$90-100m. As a consequence, taking the mid-point of this guidance, shareholders' equity could fall to a negative A$(1,356)m.
As the group’s chairman Elizabeth Bryam points out, shareholder’s equity “is just an accounting measure” and the group’s shares have a market capitalisation of A$1.3bn. A quick back-of-the-envelope calculation might suggest that with the group ascribing a value of A$2bn to Velocity, the market is valuing the group’s airline operations at a negative A$(700)m.
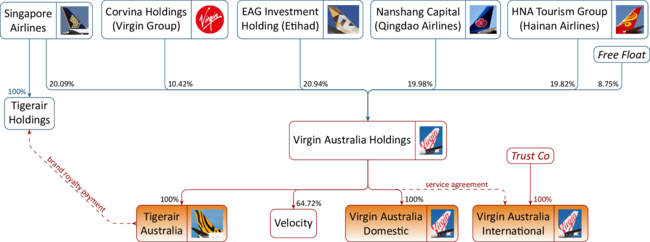
However, the Australian Stock Market’s assessment of the shares may be irrelevant: there is less than 10% of a free float. In the chart we show a simplified view of the Virgin Australia corporate structure. Unusually, Australia places no limit on foreign shareholdings in domestic airlines. Over 90% of the ordinary shares are tightly held by foreigners: founder Richard Branson’s Virgin group still has 10% through a Bermuda-based Corvina Holdings, while 20% each are held by other airlines — SIA, Qingdao, Etihad and Hainan — all of which would no doubt like to see some benefit from their shareholding (the latter two currently also financially challenged). An Australian international airline still has to be majority owned by Australian nationals, and Virgin Australia Holdings only owns one share (out of over 2m) in the international operations (which encompass both the Virgin and Tigerair brands’ international flights).
Australia — a two airline market
Australia is an unusual airline market. The continent has a huge land mass of 7.7m km2, but a population of only 25.5m (a density of just over 3 people per square kilometre). There is a lot of empty space. It is highly urbanised: 65% of the population live in the four main cities of Sydney (population 5.2m), Melbourne (4.9m), Brisbane (2.5m), Perth (2.1m) and Adelaide (1.35m). Distances between the main urban centres are large, with limited realistic transport alternatives to air travel.
In the context of the Asia-Pacific region these population centres are tiny (see Aviation Strategy Sept/Oct 2019) and Sydney, the largest metropolis, is smaller than the 20th largest in China.
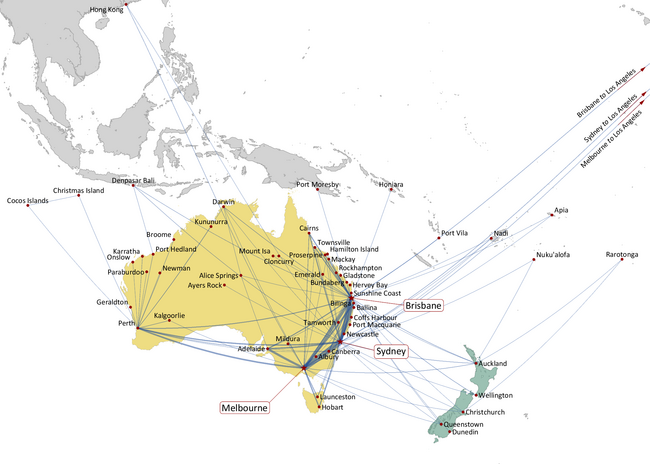
The domestic air system is characterised by a “golden triangle” of routes between Melbourne, Sydney and Brisbane. Indeed Melbourne to Sydney is the second largest route in the world by number of flights offered (and fourth largest in terms of seats). Moreover 44% of all domestic air trips touch Sydney.
Domestically it is a two airline market, and has been for decades. Virgin Australia has a 36% share of the total number of seats compared with the Qantas Group’s 57%. Traffic growth has been modestly good over the last 20 years growing at a compound rate of 3.5% a year in passenger numbers (although a more modest 2% a year since the last peak, and an annual average 0.7% in the last five years).
Internationally it is more complex. The country has 20 designated international airports, but 90% of international traffic is concentrated on the four main cities. However, the centres to which passengers really want to fly are a long way from anywhere. Qantas has its “Sunrise” project targeting ultra-long haul non-stop services: it is operating Perth-London (14,500km) and has plans for Sydney-London (17,000km) and Sydney-New York (16,000km). But on the whole (excluding the important trans-Tasman operations to New Zealand which account for 18% of international seats) inter-regional routes to Australia have to stop somewhere, while intra-regional routes are subject to intense in-bound competition.
The new CEO has a tough job ahead of him to get the airline operations to a sustainable level of profitability. Virgin Australia, playing second fiddle to flag carrier Qantas, is in a difficult position. But it does have Richard Branson and the Virgin brand. And it does have Delta Airlines as a friend. But it will need to tap its shareholders for new funds.
| @30 June | 2017 | 2018 | 2019 | Avg Age | Orders |
|---|---|---|---|---|---|
| 737-700/800 | 80 | 85 | 85† | 9.1 | |
| 737MAX | 40 | ||||
| A320 | 16 | 15 | 15∗ | 11.8 | |
| E190 | 7 | ||||
| A330 | 6 | 6 | 6 | 6.8 | |
| 777 | 5 | 5 | 5 | 10.3 | |
| ATR72 | 13 | 8 | 8 | 6.6 | |
| F100 | 14 | 14 | 14 | 27.4 | |
| Total | 141 | 133 | 133 | 11.1 |
| Velocity impact | AASB16 Impact | ||||
|---|---|---|---|---|---|
| end June 2019 A$m | change | Proforma (1) | change | Proforma (2) | |
| Fixed assets | 3,202 | 3,202 | 1,100-1,300 | 4,402 | |
| Intangible assets | 581 | 581 | 581 | ||
| Other | 520 | 520 | 520 | ||
| Cash | 1,740 | (376) | 1,364 | 1,364 | |
| Creditors | 269 | 269 | 269 | ||
| Other | 157 | 157 | 157 | ||
| Current assets | 2,165 | (376) | 1,790 | 1,790 | |
| ST Debt | (772) | 570 | (202) | (202) | |
| Debtors | (929) | (929) | (929) | ||
| Advance sales | (1,263) | (1,263) | (1,263) | ||
| Other | (273) | 8 | (265) | (90-100) | (360) |
| Current liabilities | (3,237) | 578 | (2,659) | (2,754) | |
| Net Current Liabilities | (1,072) | 203 | (869) | (964) | |
| Long Tern Debt | (2,257) | (932) | (3,189) | (1,850-2,050) | (5,139) |
| Other liabilities | (356) | (356) | (350-450) | (756) | |
| Net Assets | 619 | (730) | (111) | (1,356) | |
| Share capital | 2,239 | 2,239 | 2,239 | ||
| Reserves | 118 | (682) | (564) | (1,809) | |
| Retained earnings | (1,766) | (19) | (1,785) | (1,785) | |
| Shareholders’ equity | 590 | (701) | (111) | (1,356) | |
| Minority interests | 29 | (29) | |||
| Total Equity | 619 | (730) | (111) | (1,356) | |
Notes: Proforma (1) after repayment of Nov-19 US$ notes, issuance of US$425m and A$325m unsecured loans and acquisition of the Velocity minority. Proforma (2) company estimates of the effect of accounting for leases.
| Domestic | International | LCC | FFP | ||||||
|---|---|---|---|---|---|---|---|---|---|
| Virgin Australia | Qantas | Virgin Australia | Qantas | Tigerair | Jetstar | Velocity | Qantas Loyalty | ||
| Revenues | 3,915 | 6,106 | 1,305 | 7,425 | 563 | 3,961 | Revenues | 411 | 1,654 |
| Operating profit | 133 | 740 | (76) | 285 | (45) | 370 | Operating profit | 122 | 374 |
| Margin | 3.4% | 12.1% | -5.8% | 3.8% | -8.0% | 9.3% | Margin | 29.7% | 22.6% |
| ASK | 27,240 | 33,866 | 17,763 | 69,571 | 6,200 | 47,993 | Members | 9.8m | 12.9m |
| Load factors | 79.5% | 77.8% | 86.0% | 86.1% | |||||
| Yield | 18.11¢ | 23.18¢ | |||||||
| RASK | 14.40¢ | 18.03¢ | |||||||
| CASK | 13.88¢ | 15.84¢ | |||||||
| CASK ex fuel | 8.90¢ | 8.37¢ | |||||||
| Fleet | 96 | 159 | 22 | 55 | 15 | 94 | |||
| Destinations | 39 | 56 | 15 | 26 | 12 | 39 | |||
Note: FY end June
Note: FY end June

