United Rejects Commoditisation and
Embraces Differentiation
Sep/Oct 2023


United Airlines is the third largest airline in the USA behind Delta and American, but it has the highest exposure to international and long haul markets: pre-pandemic its two Legacy rivals generated 28-30% of their turnover from their international operations, while United produced 40% of its revenues internationally.
In 2022, the force of pent-up air travel demand in the recovery from the pandemic led to strong domestic and short haul international traffic. In the current year that has switched strongly to demand for international services playing nicely into United’s portfolio of routes.
Record Q3 Results
In its third quarter results for the three months ending September 2023, United proudly announced a record level of group quarterly revenues at $14.5bn, 12.5% up year on year and 27% higher than that achieved in the same pre-pandemic period of 2019. Domestic revenues were up by 9% year on year on the back of an 11% growth in seat mile capacity — an underlying unit revenue decline of 2% was relatively benign in comparison with the rest of the industry for the period. Without going into details, the company stated that the domestic system “remains solidly profitable”.
The stellar performance was on international services. United had pushed a lot of capacity on the Atlantic this year, adding 12% in the number of available seat miles compared with Q2 2022 and increasing its share of the market from to 14% from 10% in 2019. In total United’s capacity and traffic on the Atlantic was 34% higher than in the same period in 2019. (To be fair, its joint venture partner Lufthansa has had difficulties returning capacity to the long haul markets, and there appears to be little overall difference in the JV’s combined share of around 21%). Revenues on the Atlantic in the quarter were 15% higher than in the prior year period and an astounding 70% higher than in the third quarter of 2019.
United is also the US market leader on the Pacific with a near 16% share — up a couple of points from four years ago. Countries in the Asia/Pacific region were much slower in reopening borders after the crisis. Japan was able to relax controls in the last quarter of 2021, but China only really started allowing cross-border traffic from the beginning of 2022. United’s Q2 capacity and demand to the region increased by 86% year on year — although absolute levels remained 24% below those in Q3 2019. Those passengers who are flying are willing to pay for the privilege: revenues nearly doubled to a point where they were 7% higher than pre-pandemic levels.
Again without giving details, the Company stated that “profits were at record highs in both the Atlantic and Pacific regions”.
On a consolidated basis, passenger numbers and demand in passenger miles were up by 14%, load factors down by 1 percentage point and passenger unit revenues fell by 1%. Unit costs fell by 3.6%, helped by lower fuel prices although ex-fuel unit costs rose by 2.6% possibly reflecting restaffing and new collective agreements. Adjusted operating profits came in at $1.8bn, 20% higher than the year before and reflecting a 12% operating margin.
For much of the 2010s United’s total revenues stagnated — hovering at $37-40bn before picking up slightly in 2019. Admittedly inflation was low, the industry was consolidating, which enabled the Legacy carriers to enjoy the first period of really strong profitability since deregulation.
The trailing twelve month results indicate a new level of profitability. Revenues for the year to end September topped $52bn — a third higher than the average for the last decade. Forecasts suggest revenues could top $61bn by 2025. Adjusted net profits come in at $3.5bn, 16% higher than those achieved in 2019.
| 2019 | 2020 | 2021 | 2022 | 2023‡ | @ end | Sep 2023 | Dec 2019 | ||
|---|---|---|---|---|---|---|---|---|---|
| Revenues | 43.26 | 15.36 | 24.63 | 44.96 | 52.49 | Fleet and other fixed assets | 51.24 | 44.42 | |
| Net result | 3.01 | (7.07) | (1.96) | 0.74 | 3.48 | Current Assets | 4.83 | 3.25 | |
| Cash and equivalents† | 17.09 | 4.94 | |||||||
| Operating cashflow | 6.91 | (4.13) | 2.07 | 6.07 | 8.98 | Total Assets | 73.15 | 52.61 | |
| Capex and investments | (4.66) | (1.72) | (2.00) | (4.68) | (7.66) | Long term debt and leases | (30.50) | (18.31) | |
| Free cash flow | 2.25 | (5.85) | 0.07 | 1.39 | 1.32 | Other liabilities | (9.05) | (7.83) | |
| Net change in debt | 0.37 | 11.21 | 5.86 | (3.35) | (2.65) | Current liabilities | (24.76) | (14.94) | |
| Equity raised (bought back) | (1.65) | 1.75 | 0.53 | Total Liabilities | (64.30) | (41.08) | |||
| Change in cash† | 0.97 | 7.11 | 6.46 | (1.96) | (1.33) | Shareholders’ funds | 8.85 | 11.53 |
Product differentiation the key?
Speaking on the results' call, CEO Scott Kirby was adamant. He appears firmly of the opinion that the (US) airline industry is not just a mere commodity and that the ULCC mantra that the lowest cost provider will win is fallacious; that the industry will recover its “natural” 1% revenue proportion of GDP; that the industry cost structure changes (which United helped foster) — with all major players boosting pilot wages by 40% in the face of severe pilot shortages — will change the structure of the domestic industry. There will be a shakeout in 2024, the ULCCs will disappear, and all will be rosy.
This may be overly optimistic rhetoric. But United says it has done a good job in “product differentiation”. It claims it as built a “winning strategy around giving customers choice when it comes to the level of service they want”. It introduced premium economy services in 2019 (taking nearly thirty years to catch on to EVA Air’s 1991 innovation) and has found that revenues have outpaced capacity growth since its introduction. The company noted that in the third quarter revenue from premium products was up 20% year-over-year and accounts for more than half of all passenger revenue.
They have a “Basic Economy” product, introduced in 2017 (five years after Delta initiated one) and designed to offer the equivalent to the offerings from the ULCCs: a no-frills fare, with one small personal item to fit under the seat in front; carry-on luggage to store in overhead bins is charged a fee (unless the passenger is a MileagePlus member with Premier status, holds the right type of MileagePlus credit card or is flying internationally); checked in luggage for a fee (unless flying internationally on the Pacific).
This product they say “has also provided another popular option for customers and has been a great competitive offering with revenue... up 50% year-over-year”. CEO Scott Kirby noted that “Basic Economy” now accounts for 12% of domestic passengers.
United Next
In June 2021 United placed the largest aircraft order in it history — for 200 737MAX and 70 A321neos. It followed by announcing its latest transformation plan entitled “United Next”. The tenets of the plan are to increase aircraft gauge to reduce the marginal unit cost of capacity introduction; concentrate on denser aircraft and higher frequencies on existing markets rather than increase scope of the network by entering new domestic markets; drive feed to its international services where it feels it has superior margins.
United historically has had the lowest aircraft seat density in the domestic market as the chart shows. In 2019 it averaged 104 seats per aircraft departure on domestic routes, behind its major legacy competitors and well behind the 175 seat average for the ULCCs.
A major reason is its use of small regional jets: which accounted for a third of all domestic departures. These aircraft are not suitable for the product differentiation it needs to ensure what Kirby calls the “de-commoditization” of the product. So in hand with the delivery of new narrowbodies, the plan envisaged disposal of 200 regional jets (of the 580 it had in 2019) leading to a 30% increase in aircraft gauge, a 75% growth in “premium” seats per departure, an 8% reduction in unit-costs ex-fuel (and a target 14% operating margin) by 2026.
United continued its aircraft order spree with an order in December 2022 for 100 787s (plus 100 options) — Boeing’s single largest 787 order — and added another 100 737MAXs to its order position. And then in October this year the company ordered another 110 aircraft — 50 787s and 60 A321neos for delivery 2028-31 — while adding another 50 787 options and 40 A321s for the end of the decade.
(In June 2021 United had also announced plans to acquire 15 Boom Overture supersonic aircraft with 35 options for delivery from 2029 — see Aviation Strategy, June 2021. That particular aircraft type doesn’t yet appear in the books.)
Unusually, United has a much larger mainline fleet now than it did in 2019 (see table): taking delivery of 25 widebodies and 140 narrowbodies in the intervening period. The regional fleet on the other hand is down by a net 111 units.
A further element of the United Next plan is to concentrate on international growth. Scott Kelly clearly sees United as the USA’s flag-carrier, and wants to capitalise on the superior margins he sees in international flying. On the results call, he suggested that there may be a pause in 2024 in the rate of expansion on the Atlantic, implicitly suggesting the focus next year will be on restoring the Pacific.
Growth to 2026 according to the plans will be a modest 4-6%, primarily driven by increase in aircraft size. But somewhat enigmatically he said that the airline would “pivot to global growth in 2025-30”.
The United Next plan has raised some concerns over the group’s financial position: debt has doubled since 2019, and capital expenditure is running high — with c$8bn in the current year. But the company appears confident that by 2026 its net debt will be back below pre-pandemic levels and that its net debt to EBITDAR could be under 2.5x — almost approaching investment grade.
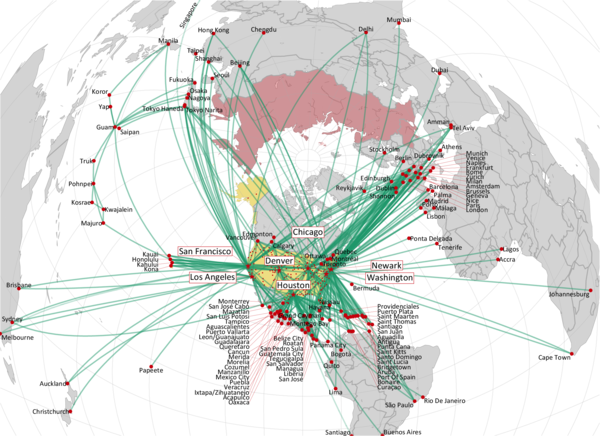
Airspace over Russia and Ukraine (marked in red) currently unusable: those great circle routes shown traversing it subject to diversion.
MileagePlus
Modestly, Scott Kirby considers that United’s loyalty program, MileagePlus, is “the most attractive program in the world for customers, and therefore generates significantly directly earned EBIT, significant loyalty, but also significant opportunity to do even more with it in the future”.
In June 2020, in desperation for cash, United established a highly innovative financing structure to raise $6.8bn secured by the cash flows of its frequent flyer programme (FFP) — see Aviation Strategy, Jul/Aug 2020. None of the US carriers explicitly detail the earnings power of the FFPs in their regulatory filings (Qantas has for many years, and IAG has just started to do so). United in its presentation at the time highlighted that MileagePlus was consistently profitable and was responsible for generating a quarter of the group’s EBITDA.
This quarter’s results statement made little mention save that: “The third quarter showed a continued multi-year new MileagePlus member trend, setting a record for third quarter enrolments and nearly doubling the number of new members versus the third quarter just five years ago. Spending across the US card portfolio year-to-date is up double-digits over the first three quarters of 2022 and this third quarter saw more miles redeemed across the program than any third quarter in history for award travel.”
Kirby did however mention that we should expect to hear a lot more details from United on this front, “starting at an investor day in early 2024”.
However, there is currently a little piece of proposed legislation before in the US Senate, “The Credit Card Competition Act of 2023”, which might undermine the validity of credit card loyalty schemes such as MileagePlus. Put forward by Senators Dick Durbin (D) and Roger Marshall (R) it aims to introduce greater competition in credit card payment processing and reduce the underlying cost to merchants for accepting payments. The proponents point out that the Visa-Mastercard duopoly controls 80% of US credit card network market — more than 576m cards — and that in 2022 they and the issuing banks charged merchants a total $93bn in fees. This they argue inflates costs to the consumer by up to 3% (the US has some of the highest card interchange fees in the world, and unlike the EU has not introduced a fee cap).
The proposal is to force large card issuers to enable at least two credit card networks to be used on their credit cards instead of just one, and at least one of those networks must be a network other than the Visa or Mastercard. Then the merchant would get to choose which of those networks to use to process a transaction.
They tried once in 2022, and again mid-2023, but failed to get the bill attached to the National Defense Authorization Act; they have apparently been promised a vote on the bill before the end of the year.
The Act has been nicknamed “Durbin 2.0”, because Sen. Durbin introduced an amendment to the Frank-Dodd Act in 2010 that did the same thing for debit cards: that, opponents say, killed off debit card loyalty programmes, and free checking-accounts, for a net disbenefit to consumers.
If passed it might destroy the current US business model of FFPs: the high interchange and credit card fees are in part used to buy the miles and other goodies that FFP members enjoy as their rewards.
| In Service | Parked | Total | Δ v 2019 | Avg age | Orders | ||
|---|---|---|---|---|---|---|---|
| Widebodies | 777-300ER | 22 | 22 | ↑2 | 5.8 | ||
| 777-200ER | 52 | 3 | 55 | 23.6 | |||
| 777-200 | 19 | 19 | 26.3 | ||||
| 787-10 | 21 | 21 | ↑10 | 3.3 | |||
| 787-9 | 37 | 1 | 38 | ↑13 | 6.1 | 150 | |
| A350 | 45 | ||||||
| 787-8 | 12 | 12 | 10.3 | ||||
| 767-400ER | 15 | 1 | 16 | 22.1 | |||
| 767-300ER | 34 | 3 | 37 | ↓1 | 27.6 | ||
| Widebodies | 212 | 8 | 220 | ↑24 | 16.9 | 195 | |
| Narrowbodies | 757-300 | 20 | 1 | 21 | 21.1 | ||
| 757-200 | 36 | 4 | 40 | ↓13 | 26.7 | ||
| 737 MAX 10 | 376 | ||||||
| 737 MAX 9 | 72 | 2 | 74 | ↑74 | 2.2 | ||
| 737 MAX 8 | 63 | 63 | ↑63 | 2.1 | |||
| 737-900ER | 124 | 12 | 136 | 10.8 | |||
| 737-900 | 12 | 12 | 22.0 | ||||
| 737-800 | 128 | 13 | 141 | 19.6 | |||
| 737-700 | 36 | 4 | 40 | ↓1 | 24.5 | ||
| A321neo | 130 | ||||||
| A321XLR | 50 | ||||||
| A320-200 | 90 | 9 | 99 | ↑2 | 24.9 | ||
| A319-100 | 75 | 6 | 81 | ↑1 | 21.9 | ||
| Narrowbodies | 656 | 51 | 707 | ↑126 | 16.3 | 556 | |
| Total mainline | 868 | 59 | 927 | ↑150 | 16.4 | 751 | |
| Regional | E175 | 183 | 183 | ↑13 | |||
| E170 | 35 | 35 | ↓3 | ||||
| ERJ145 | 63 | 63 | ↓112 | ||||
| CRJ700 | 20 | 20 | ↓27 | ||||
| CRJ550 | 36 | 36 | ↑18 | ||||
| CRJ200 | 133 | 133 | |||||
| Regional | 470 | 470 | ↓111 | ||||
| Total fleet | 1,338 | 59 | 1,397 | ↑39 |
THROUGH THE PANDEMIC (AND BEYOND)
