Re-engined types and the delivery cycle
September 2011

So Boeing has finally succumbed to the pressure from Toulouse and despite many expectations announced a re–engined option for the 737NG family — under the soubriquet of 737 MAX.
Boeing is promising a 16% reduction in fuel spend per seat (and an extra 4% advantage against the A320neo) — using the CFM Leap-1B (against Airbus’s choice of the PW1100G) — and expects deliveries to start in 2017 (more than a year after the expected first A320neo). After the success of the A320neo launch — since December 2010 there have been an unprecedented number of orders for over 1,000 aircraft — the Boeing board obviously finally decided that an all–new product offering in the short–haul, workhorse section of the industry (nicknamed the Boeing Y1) would leave it with too much of a product disadvantage. As such a product would probably not be in production until the early 2020s and after billions of R&D; and the engine technology required to achieve the fuel cost savings to provide a truly significant product advantage still remains on drawing boards.
In doing so it may have given up the idea in the short run of producing a new short–haul single aisle aircraft design as a significant step change to differentiate its offering from its competitors; and these competitors in the short–haul product market are expanding, with the C–Series from DHC, the Superjet from Sukhoi, MS–21 from Irkut, MRJ from Mitsubishi and the C919 from COMAC of China. At the 737 MAX announcement, Boeing also stated that it had received order commitments for nearly 500 units of its new offering.
Meanwhile concerns may be emerging over potential overcapacity resulting from the current order backlog; a recent report from UBS estimated that the backlogs at the two main manufacturers were over–ordered by around 15–20% (or that the backlog if delivered would have to be supported by a compound annual growth in traffic of some 7% over the next five years) and suggested that a large portion of this excess would be deferred or cancelled. Their analysis highlighted that of all the regions only North America had not ordered enough equipment (albeit this was done before the recent American Airlines order) while their calculation of the total potential excess capacity in the backlog of some 1,200 units roughly matched the then total backlog ordered by leasing companies.
This sort of analysis is notoriously awkward — and depends on so many assumptions of medium–term growth rates, load factors, retirement and scrappage rates.
ESG’s Airline Monitor on the other hand is more sanguine in its latest market forecast (although done before the Boeing re–engining decision). A major element of its analysis and forecasts works on the basis of ideal supply (based on optimum aircraft performance) and perennially shows a year–end capacity “surplus” in the industry; the lowest surplus (1% of supply) was achieved in the peak industry years of 1997 and 1998 — while in the past two years this surplus has averaged 11%. ESG’s assumptions — more bullish than even Boeing’s for the next twenty years with forecast RPK growth of 5.5% — suggest this “surplus” declining over the next five years to below 5%.
At the moment there are nearly 8,500 aircraft on firm order by passenger and freight operators (43% of the operational fleet at the end of 2010), three–quarters of which are due to be delivered before the end of 2017; after a dip in 2009 the total number of aircraft orders bounced back to over 1,600 units in 2010 and appears likely this year also to exceed the 1,200 mark. It is easy to be beguiled by gross statistics but this backlog works out as potential annual deliveries of no more than 6% of the fleet; similar to the historic average rate of new deliveries required for replacement and growth.
However, the backlog at the end of 2010 accounted for an estimated and unprecedented 7.4 years of deliveries (up to 2005 the industry averaged a backlog of 3.3 years of production) showing that at least in this cycle the two main manufacturers may have been showing unusual restraint in restricting production (although both are planning increases in production rates); and the absolute size of the current backlog is nearly three times the size it was in 2003 — the trough of the last order cycle.
Leasing companies appear to account for around 20% of the total backlog; and of the airline orders (where the operator is known) 32% are from carriers based in Asia, 21% in Europe and 24% in North America (and that includes the AA order).
Of the aircraft types in the backlog, 71% are represented by the short–haul single aisle (and 61% for the A320 or 737) while 27% for the major manufacturers' twin–aisle offerings. Of the 230 named airline operators' orders over 40% of the total backlog is represented by 25 airlines (and 80% of the total by 80 airlines) and the largest single aircraft orders are from AirAsia (311 units, or 3.6%), American Airlines (292), IndiGo (232) and Emirates (189); although to be fair AirAsia’s backlog extends through to at least 2025.
Meanwhile, in its 2011 Current Market Outlook, Boeing has raised its forecast for deliveries over the next twenty years by a little under 10% from the 2010 CMO figures.
This is partly based on a slightly higher rate of growth forecast for the world economy at around 3.3% a year, and generates a forecast rate of demand growth in RPK of around 5.1% a year. It has also raised its expectations for demand for single aisle aircraft to 70% of total deliveries, (compared with the current order backlog of 72% of the total) and slightly reduced its forecast of widebody deliveries as a proportion to 24% of the total.
The largest changes are on the estimates of delivery by region — (reflecting greater optimism in the BRIC economies) with forecasts of Asia Pacific deliveries raised by over 10% (to account for 34% of future aircraft unit demand, with China alone accounting for 5,000 future deliveries or 15% of the total), LatAm deliveries by nearly 18% (8% of the total) and CIS up by 12% (3% of the total). It has also raised its forecasts for Europe and North America but only by around 5%, highlighting a continued shift away from the more mature markets (for 2011 to 2030 it is forecasting a modest average 2.3% growth in North American traffic, 3.6% growth on the North Atlantic and 4% within Europe). At the same time its long range forecasts for deliveries assume a geographical distribution not noticeably different from the make up of the current order backlog.
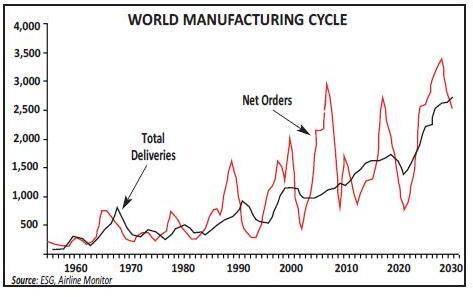
Aircraft deliveries had been fairly static through the 2000s, averaging around a 1,000 units each year; and the peak to trough decline in deliveries of a mere 5% showed a remarkably shallow cycle (in the previous three cycles this ratio has run at a “normal” 25%-40%). Of course this remarkable constraint by the manufacturers through this cycle has allowed the backlog to build to record levels in both terms of a percentage of the fleet and in absolute numbers. The manufacturers however will have to increase their production rates to meet medium term forecasts — and Airline Monitor is assuming average aircraft deliveries of nearer 1,500 units a year through to 2020 with a peak of 1700 units by the end of the decade — although the manufacturers may decide that it need not be necessary to aim to fulfil every single order.
The current backlog may represent an element of over–ordering and could, if fully delivered, engender a period of overcapacity.
At the same time it could well be that changing perceptions of the long range price of fuel (and in Europe the introduction of the ETS) further accelerates decisions to retire older aircraft earlier and that this may give operators greater leeway to maintain balance.
| Aircraft Family |
2012 | 2013 | 2014 | 2015 | 2016 | 2017 | Post 2017 or undated |
Total Backlog |
|---|---|---|---|---|---|---|---|---|
| A320 | 467 | 473 | 415 | 312 | 220 | 203 | 769 | 3,035 |
| A330 | 115 | 115 | 56 | 10 | 5 | 0 | 342 | |
| A340 | 4 | 4 | ||||||
| A350 | 5 | 39 | 47 | 84 | 115 | 273 | 563 | |
| A380 | 31 | 28 | 31 | 25 | 19 | 14 | 18 | 181 |
| B737 | 391 | 375 | 350 | 334 | 245 | 127 | 225 | 2,185 |
| B747 | 26 | 22 | 23 | 8 | 4 | 2 | 5 | 105 |
| B767 | 20 | 13 | 4 | 0 | 47 | |||
| B777 | 71 | 92 | 60 | 50 | 10 | 3 | 2 | 314 |
| B787 | 67 | 96 | 139 | 146 | 133 | 78 | 151 | 819 |
| C919 | 10 | 16 | 19 | 45 | ||||
| CRJ | 16 | 11 | 3 | 11 | 1 | 4 | 61 | |
| C-Series | 1 | 28 | 42 | 38 | 13 | 11 | 133 | |
| ERJ | 81 | 27 | 20 | 17 | 14 | 8 | 21 | 253 |
| MRJ | 14 | 32 | 19 | 0 | 65 | |||
| MS21 | 6 | 14 | 108 | 128 | ||||
| SSJ | 22 | 36 | 52 | 45 | 24 | 22 | 3 | 213 |
| Other | 66 | 41 | 31 | 28 | 3 | 3 | 10 | 198 |
| TOTAL | 1,373 | 1,335 | 1,265 | 1,107 | 835 | 618 | 1,613 | 8,493 |
| % fleet | 6% | 6% | 5% | 4% | 3% | 2% | 6% | |
| Airbus | 613 | 621 | 541 | 394 | 328 | 332 | 1,064 | 4,125 |
| Boeing | 575 | 598 | 576 | 538 | 392 | 210 | 383 | 3,470 |
| Other | 185 | 116 | 148 | 175 | 115 | 76 | 166 | 898 |