Up, up and ...?
September 2010


The air transport industry is remarkably resilient. It can get knocked off its long term growth path by extraneous events, but bounces back. The global recession sparked off by the collapse of Lehman Bros two years ago had a dramatic impact on the industry: 2009 saw a decline in overall traffic volumes of 3–4%, with a slightly higher rate of decline in international traffic, to mark only the second year in the industry’s history that traffic had actually fallen. Yields however collapsed by an astonishing 13% — the largest annual decline experienced in the industry’s history, although partly because fuel prices also fell in the period – and it is estimated that the industry generated an operating loss of $1.2bn and a net loss of nearly $10bn for the year.
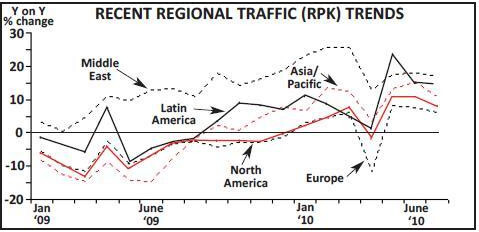
We are now surely in the upturn of the cycle. Since the beginning of 2010 the year–on–year rate of growth has been far better than many might have expected – with the exception of the disruption caused by the closure of European air–space in April following the eruption of an unpronounceable Icelandic volcano. IATA has reported an average growth in RPKs of 8% on international traffic since January against a relatively muted growth in capacity. Load factors rebounded to over 80% in July, three points higher than the previous year, while the average improvement in load factors so far this year has averaged five percentage points. These increases of course are in light of a comparative period of severe declines but June traffic appeared to have had regained the peak levels of 2008.
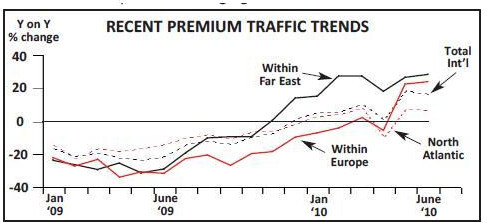
Premium passengers have been coming back in droves as the world economy and business confidence has improved and annual growth in premium cabins this year is estimated at over 10% (although at times in 2009 the rate of decline in some areas was approaching 35%). Intriguingly, premium traffic within Asia has been exhibiting average growth of over 20% since December last year. However, even after these increases, total premium traffic volumes appear to be some 7% below the peak levels in 2007 – and in Europe particularly (where business- class travel has been in decline for many a year as the LCC revolution has developed) still a hefty 25% below the levels in that year.
Within this global data however, there are some increasing signs of the disparity in economic performance in differing regions. In the Far East the OAPA reports an average growth in traffic of over 15% since the end of 2009 (and 25% growth in premium traffic) highlighting that the powerhouse of China and developing economies in Asia are ignoring the plight of the budget deficits of the developed economies. At the same time, carriers in the Middle East continue to pursue their high growth strategy to develop the Gulf region as competing international hubs.
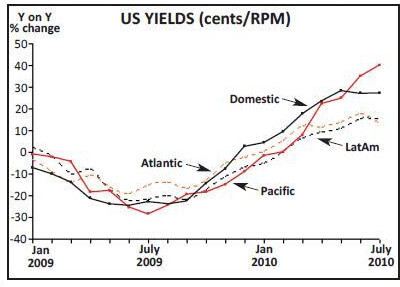
ATA is the only body to publish timely data on yields – although the data only relates to a sample of the top US airlines. As the chart below shows, after the disastrous performance of 2009, all route areas operated by the US carriers selected have shown accelerating improvements in traffic yields – highlighted by a near 40% increase in July data on the Pacific routes. Of course the yield data is somewhat obscured by the movements in fuel prices over the past three years and these rates of growth appear high – but Domestic, Atlantic and LatAm routes still display average yields 5- 8% below those achieved in 2008, with only the highly marginal Pacific routes showing a recovery in yields to pre–crisis levels.
The airline industry displays various different cycles of its own – and apart from traffic demand related data one of the more important is that of the aircraft orders and delivery cycle; and if we wanted any other evidence it is here too that there are distinct signs of the upturn.
Farnborough this year allowed the major manufacturers to boast a boost to their order books – and gave rise to Airbus comments that it was doubling its full year forecast of new net orders. Indeed by the middle of the year the two majors had notched up new orders for 530 aircraft – equivalent to the total net new orders achieved in 2009. Boeing used the occasion to publicise its Current Market Outlook in which it up–rated average annual traffic growth forecasts for the next 20 years to over 5% in RPK terms (upgraded mainly because of the dip in 2009). Both manufacturers now seem set to increase production levels – particularly of the 737/A320 industry workhorses – over the next two years to help cover the backlog of orders in this segment. Intriguingly at Farnborough, the major orders announced were from leasing companies – and in particular Steve Udvar- Hazy’s new ILFC look–alike vehicle – hinting that whereas some airlines may not yet have the confidence, the finance professionals believe in the future demand potential (see page 13).
There are distinct signs that the economic recovery is two–toned; that the performance of the developing economies may well accelerate the creation of a consumer base independent of the developed nations – particularly in Europe and the US — which are likely to be held back by the after effects of the budget deficits following the financial crisis. (IATA indeed is forecasting strong recovery in profit potential this year in all areas except Europe). It is almost certain that from now on that the high growth rates will reduce as the year–on–year effects dissipate. It is also possible that the developed nations will avoid the dreaded double–dip recession and the airline industry indeed return to profitability.


