What is the future of the European flag-carrier?
September 2002

European aviation is beginning a process of major restructuring. Serious flaws have developed in the traditional European flag–carrier business model, and the competitive landscape of 2005 will likely look quite different than that of 1995. As in the US, the future viability of the industry’s dominant business model and its major airlines has been openly questioned.
Discussions of airline business models, demand segmentation and traffic flows can sometimes seem a bit dry and academic. The data and analysis presented here were originally developed in 2000, by the management of two mid–sized flag–carriers whose existing strategy was clearly unworkable and whose survival was highly uncertain. This article addresses a set of questions faced by every European carrier struggling to establish a basis for sustainable future profits, including:
- What drives competition between the major European carriers?
- Why have some European hubs been more profitable than others?
- What caused the industry–wide profit collapse of the late 90s?
- Are the industry’s problems largely cyclical, or is the economic logic underlying the traditional flag carrier business model obsolete?
- Is the economic logic underlying new entrant business models powerful enough to threaten the survival of the flag–carriers?
- What new business models would give flag–carriers the greatest chance of surviving the coming industry shakeout?
The challenge facing Swissair and Sabena in 2000
In 1999, Swissair had a minus 4% profit margin while Sabena had a minus 6% margin, after having earned small profits in the previous two years. These declines mirrored downward profit trends among airlines across Europe. Both airlines were financially healthy, in the sense of having strong positive cash flow, easily meeting all current obligations, and having much of their networks earning fully allocated profits. Although no national airline in Western Europe had ever failed before, both carriers were destroyed and liquidated within eighteen months.
In 1997, the Swissair Board abandoned its previous airline–based strategy that utilised alliances with major intercontinental carriers (Delta, Singapore) and other middle–tier European flag–carriers (Austrian, Sabena, SAS) to augment the scope of Swissair’s brand and Zurich–based network. The new SAir Group conglomerate strategy (code–named "Hunter") withdrew assets from Swissair and invested them in service businesses (catering, IT) and smaller European airlines where SAir Group could exercise full control. The Network, Marketing and Financial management of Swissair and Sabena was combined in 1999 although there was no plan to merge brands or operations. Swissair- Sabena management remained completely separate from the management of the SAir Group holding company, and had no responsibility for any of the other newly acquired carriers.
Network Management for Swissair and Sabena knew that the both carriers were in a highly vulnerable position, given the industry–wide profit declines, the increasing vulnerability of all mid–sized flag–carriers, and the obvious failure of the SAir Group’s fleet and outside business investments. In 2000, Network Management undertook a major, internal study to evaluate whether either Swissair or Sabena could survive in the long–term and to recommend specific changes and actions that would give the greatest chance of a competitive and financial turnaround.
The study assumed (heroically, as it turned out) that the airlines could somehow be reorganised independently of the SAir Group conglomerate investments, and focused strictly on the issues facing Swissair, Sabena and the other large airlines across Europe.
The classic "flag-carrier" business model
| Departures per day | |||
|---|---|---|---|
| Hub | Carrier | Total | Intercon |
| First division hubs 55% ASKs |
|||
| LHR | BA | 265 | 54 |
| FRA | LH | 377 | 46 |
| CDG | AF | 339 | 50 |
| AMS | KL | 366 | 43 |
| Second division hubs 36% ASKs |
|||
| LGW | BA | 183 | 21 |
| ZRH | SR | 247 | 23 |
| MAD | IB | 151 | 13 |
| MXP | AZ | 192 | 12 |
| BRU | SN | 234 | 14 |
| CPH | SK | 286 | 9 |
| FCO | AZ | 190 | 3 |
| VIE | OS | 175 | 7 |
| MUC | LH | 220 | 5 |
| ARN | SK | 265 | 2 |
| Third division hubs 9% ASKs (Only selected hubs shown) |
|||
| ORY | AF | 211 | 2 |
| ORY | IJ, IW | 101 | 7 |
| LIS | TP | 87 | 4 |
| BCN | IB | 109 | 1 |
| LTN | U2 | 48 | 0 |
| STN | FR | 46 | 0 |
| HEL | AY | 135 | 3 |
| BUD | MA | 41 | 2 |
| WAW | LO | 52 | 3 |
| MAN | BA | 88 | 2 |
| BSL | LX, SR | 89 | 1 |
| LYS | AF | 83 | 0 |
| NCE | FU | 77 | 0 |
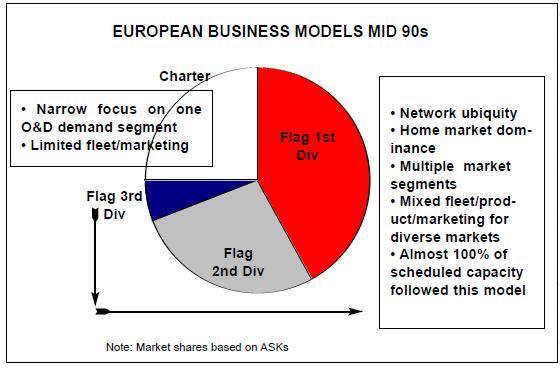
The two classic European airline business models were the "flag–carrier" model, which was designed to operate at a large scale and serve a very broad range of potential customers, and the "Charter airline" model, designed to only serve a specific, narrow demand segment. The flag–carrier model, best represented by Lufthansa’s Frankfurt hub based network, has six key features:
- Domination of travel demand from the carrier’s Home Market
- Service to multiple, diverse demand segments (business/leisure, domestic/intra–Europe/ Intercontinental, Home Market/Sixth Freedom) to maximise total travel volumes
- US–style hub operations in order to maximise connecting traffic
- A mixture of different aircraft sizes in order to maximise frequencies and hub connections
- Significant marketing infrastructure (such as worldwide sales and distribution) and systems complexity (yield management, airport operations) to efficiently serve the diverse markets.
- Rapid growth in order to capture "natural" (exogenous) demand growth and to exploit hub scheduling and operating scale economies Charter carriers aggregated demand via specialised pricing, packaging and distribution, and organised operations around larger single–class aircraft with lower unit costs, and only served O&D markets that fit into this approach.
All flag-carriers imitated Frankfurt
The central strategy question for European airlines as late as 1995 was scheduled versus charter. Almost 100% of scheduled capacity followed the "flag–carrier" model and pursued every logical source of demand in order to maximise traffic volumes and scale. The central position of the flag–carrier model was originally driven by aeropolitical factors but actually increased after markets liberalised in the early 90s. Hubs from Warsaw to Lisbon expanded service to long–haul destinations, expanded airports to handle complex hub operations and rescheduled their networks to maximise connection opportunities.
Smaller markets produced smaller airlines, but they all followed the same basic business model that Lufthansa used at Frankfurt.
In a heterogeneous marketplace, it is unnatural for any one business model to become the overwhelming standard, and it should be possible for multiple, overlapping business models to successfully serve different segments.
European demand has always been extremely fragmented due to national markets, widely varying disposable income levels and market sizes, strong distinctions between leisure and business destinations, and wide disparities in transport alternatives. To date, experimentation with new business models has been almost exclusively driven by new entrants. Airlines such as Ryanair are attempting to develop new leisure oriented markets (Stansted to Ancona or Biarritz) outside of the traditional Charter model, while easyJet and others are developing more business–oriented O&Ds while avoiding the comprehensive scope and infrastructure intensity of the traditional flag carrier model.
Airline business models are based on demand, not costs
Airlines can choose to serve multiple, diverse traffic flows or to concentrate on a narrow set of market segments. Cost structures must then be carefully tailored to the target market, but it is dangerous to segment airlines on the basis of concepts such as "low–cost". There is no such thing as a "high cost" business model. Classic charter carriers avoid many of the branding, CRS, and hub airport costs that British Airways and KLM must bear, but as a result they cannot efficiently serve more diverse scheduled markets or scale their operations to a large network size. Ryanair’s approach achieves low costs on Stansted–Ireland routes but would be uncompetitive on Heathrow–Austria routes. Airlines under any business model will fail if they add too much capacity relative to their target markets, or cannot keep costs in line with what those markets will pay for the service.
Three segments within the "flag-carrier" business model
The 2000 Swissair–Sabena study argued that industry profit trends were best explained by the performance of individual hubs, not by overall corporate results. The roles and profit potential of hubs at Gatwick, Orly, Munich and Geneva were substantially different from their owner’s hubs at Heathrow, Charles de Gaulle, Frankfurt or Zurich. In 2000, the 14 largest hubs accounted for 91% of all of the capacity operated the entire scheduled European industry.
The industry’s "First Division"-the top four hubs (British Airways at Heathrow, Lufthansa at Frankfurt, Air France at Charles DeGaulle and KLM at Schipol) alone accounted for 55% of scheduled industry capacity. The ten "Second Division" hubs each operated 175–275 daily flights under the hub carrier’s code.
Many of the 9% of scheduled ASKs in the Third Division are also tied to the flag–carrier model, including smaller national carriers with much more limited networks (Finnair, Aer Lingus, Malev, TAP), and secondary hubs of larger carriers (BA at Manchester, IB at Barcelona, AF at Orly, Crossair at Basel), designed to maximise Home Country coverage.
But this Third group also includes new entrants following different models, including domestic–focused hubs (AOM–Air Liberte at Orly, Deutsche BA), and the satellite London operations (easyJet at Luton, Ryanair at Stansted).
In 2000, these new entrants were still a tiny percentage of scheduled industry capacity.
First Division Hubs have a huge market size advantage
There is a marked difference in the size of the local revenue base between the four First Division Hubs and the ten Second Division Hubs.
The Charles de Gaulle market is three times larger than Zurich, Brussels or Munich, while Heathrow is six times larger, and these gaps would be even larger if one considered total London/Paris demand instead of the airport level demand. This size advantage of the ASK capacity operated by the First Division hubs mirrors the differences in the underlying revenue bases.
This is in marked contrast to the US hub environment where origin–market size gaps between the top tier hubs (Atlanta, Dallas, Chicago) and second tier hubs (Houston, Denver, Minneapolis, Pittsburgh, Philadelphia) are much smaller.
This also explains why new entrants using 150–seat aircraft have had success developing networks of large O&D markets ex–London, and much less success at Brussels, Munich or similar cities.
The First Division offers two to three times more Intercontinental departures than Second Division hubs, even though levels of intra–Europe service are broadly similar. SAS at Copenhagen had roughly the same number of short–haul flights as British Airways at Heathrow. Second Division carriers would have to quadruple ASKs in order to match the size and scale of the First Division.
Flag-carrier hub profitability fell by over $1bn in 1999
One cannot evaluate competitive performance or strategic issues without reference to relative profitability. The table includes Swissair estimates of the operating profitability of the 14 hubs in its competitive set. These reflect educated guesswork based on public financial information that may not break out airline and non–airline results in a consistent manner and should be used with some caution. Detailed public yield and cost data are not publicly available and thus European airlines cannot easily estimate their competitor’s route and hub profitability as US airlines can.
| Hub ASK Capacity Rank/ Index (FRA=100) |
Estimated 97-98 hub Op Profit |
Estimated 97-98 hub Op Margin |
Estimated 99 hub Op Profit |
||
| First Division hubs 55% ASKs |
LHR—BA | 1—125 | $750 m | 5-7% | $150m |
| FRA—LH | 2—100 | $550 m | 7-9% | $500m | |
| CDG—AF | 3—92 | $300 m | 3-5% | $500m | |
| AMS—KL | 4—82 | $400 m | 3-5% | $100m | |
| Subtotal | $2.0 bn | ~4% | $1.3 bn | ||
| Second Division hubs 36% ASKs |
LGW—BA | 5—46 | $75 m | 2-4% | ($25m) |
| ZRH—SR | 6—41 | $75m | 2-4% | 0 | |
| MAD—IB | 7—36 | $100m | 3-5% | $50m | |
| MXP—AZ | 8—34 | $75 m | 2-4% | ($25m) | |
| BRU—SN | 9—29 | $50 m | 0-2% | ($25m) | |
| CPH—SK | 10—22 | $75 m | 3-5% | ($25m) | |
| FCO—AZ | 11—18 | $50 m | 2-4% | 0 | |
| VIE—OS | 12—17 | $50 m | 2-4% | 0 | |
| MUC—LH | 13—17 | $50 m | 1-3% | ($25m) | |
| ARN - SK | 14-14 | $0 m | (1)-1% | 0 | |
| Subtotal | $0.6 bn | ~2% | $0.1 bn |
In 1999 the profitability of these 14 hubs fell by over $1bn (a 45% decline) from 97–98 levels, a downward trend that continued in 2000 and accelerated in 2001. More importantly, there is a structural profit gap between the First and Second division hubs. In the "good years" of 97- 98, the top four hubs operated 61% of the capacity of this group but earned 77% of the profits, a full two margin points better on average. As overall industry financial performance declined, Second Division profits declined much more rapidly, falling 85% in 1999 versus an estimated 35% decline for the First Division. Size matters.
There is no evidence in this timeframe of any smaller flag–carrier hub earning more profits than any significantly larger one.
While an obvious point, it is worth noting that 2–4% operating margins in the "good years" of a business cycle usually indicates that an industry has extremely serious structural problems and could not support new capital inflows without major restructuring.
Overcapacity and the industry profit collapse of the late 90s
The tendency of airlines to expand capacity much faster than the growth in the revenue base can be observed throughout the industry’s history, and was the primary driver of the major decline in flag–carrier profits in the late 90s. Following the forecasting approaches of the aircraft manufacturers and many consultants, many European airlines assumed that exogenous demand for their services was growing at rate several times faster than GDP growth, and rapidly expanded their fleets in order to capture the new demand and resulting scale economies faster than their competitors.
The total European flag–carrier sector grew capacity roughly 7–8% per year in the late 90s, with the smaller, weaker carriers actually growing faster than the larger, more profitable ones. The four largest First Division airlines grew at an overall average of 7%, although BA and KLM slammed the brakes on growth in 1999. These four airlines accounted for three–quarters of the industry’s overall expansion. In their rush to emulate the Frankfurt hub (and to narrow Frankfurt’s size and network scope advantages) the Second and Third Division carriers grew 12–13%, but still failed to close the size gap versus the First Division.
It is unclear whether any managers at these carriers actually believed that their core business revenue base was likely to grow at these rates, and many airlines seemed to be focusing on traffic volume and market share instead of revenue or profits. As seen in the table below, Intercon traffic grew in line with seat growth, while intra–European traffic growth lagged slightly behind. However, Intercon traffic growth was almost exactly offset by 7–8% real yield declines — the added seats were only filled by cutting prices. The real yield declines were almost (but not quite) as bad on the short–haul network.
While capacity grew roughly 35% in this period, industry–wide revenues (adjusted for inflation) barely grew at all. While there were isolated cases of profitable growth (Air France’s hub development at CDG), in the vast majority of cases this expansion did nothing except destroy corporate value.
Flag-carrier revenue and competition is driven by Intercon markets
64% of all revenue originating or terminating in Europe in 2000 was long–haul, while only 25% came from cross–border short–haul markets.
The remaining 11% was from domestic, intra- Scandinavia or UK–Ireland markets which the top 14 hubs only serve on a very limited basis.
Competition between the top 14 hubs is dominated by the dynamics of Intercon markets. 32% of the total flag–carrier revenue base comes from Intercon markets that have no nonstop service.
Many of these markets (Berlin–Los Angeles, Lyon–Tokyo, Sao Paulo–Copenhagen) have good single–carrier one–stop service from five or more competing European hubs plus alliance or interline service via non–European carriers. Long–haul markets with nonstop service (another 32% of the total revenue base) will still face significant competition from hubs offering connecting service, given the price sensitivity of these markets, and the relatively small elapsed time penalty.
Given the power of hubs, intra–Europe nonstop markets tend towards stable one or two carrier markets. On short sectors, connecting alternatives cannot compete without very deep price–cutting.
Intra–Europe O&Ds that do not have nonstop service, where passengers must connect (Bari–Paris, Stavanger–Rome) are insignificant to the larger competitive picture. In the US, narrowbody must–connect markets account for over a third of the domestic market, while in Europe the thousands of O&Ds in this category only account for 3% of the total revenue base.
Hub profitability depends on limiting low-yield connect traffic
79% of all traffic served by the top 13 hubs originated or terminated in the hub carrier’s Home Market, 68% at the hub city, and 11% on connecting domestic services such as Hamburg- Frankfurt on Lufthansa or Toulouse–Charles DeGaulle on Air France. Average yields on Home Market connect flows are generally similar to Hub nonstop levels, Swissair yields on connecting Geneva/Basel traffic were actually higher than nonstop Zurich yields at comparable stage lengths. Yield penalties on Sixth Freedom markets averaged 15–20% for Swissair and 20–30% for Sabena.
Hub profitability requires a strong mix of Home Market traffic relative to lower–yielding Sixth Freedom traffic.
Three hubs which had the misfortune of being located in smaller national markets — Amsterdam, Zurich and Brussels---had extremely high percentages of lower–yielding Sixth Freedom traffic, and. are especially exposed to revenue downturns due to industry–wide overcapacity.
Excess capacity has a disproportionately greater impact on Sixth Freedom markets. Carriers can avoid price wars in Home Country business markets such as Paris- Frankfurt, by filling empty seats with Miami- Frankfurt or Paris–Bangkok passengers instead.
Second Division hubs cannot compete for Intercon traffic
Second Division hubs with long–haul networks face a daunting challenge. Intercontinental widebodies can feed huge volumes of traffic on their existing short–haul flights, rapidly increasing the scale economies of their hubs, and significantly improving the scope of their network to the levels business customers demand. But by competing directly with Frankfurt, Paris and Amsterdam for this traffic, they end up with an unsustainable mix of Sixth Freedom connecting traffic, and the expansion needed to maximise network competitiveness disproportionately trashes their own revenue base. None of the Second Division hubs operating in 2000 could match the Intercon market share of the First Division hubs, and none of the Second Division Intercon operations were profitable in the late 90s.
Traditional flag–carriers such as Austrian and SAS who had recognised this dilemma and backed away from direct competition with Frankfurt and Paris remained frustrated by the inability to exploit the growth and scale economies of the major widebody operators.
As the table indicates, the ability to attract Sixth Freedom Intercon traffic is a direct function of the number of Intercon departures offered. With the exception of Amsterdam, every hub’s share of Sixth Freedom traffic matched (within 1–2 points) its share of Intercon departures.
| Share of Intercon | Share of Intercon | |
| Departures (Winter 99-00) | Sixth Freedom Connect Traffic (MIDT 99) | |
| LHR—BA | 18% | 17% |
| FRA—LH | 15% | 18% |
| CDG—AF | 17% | 14% |
| AMS—KL | 14% | 23% |
| First Division | 64% | 72% |
|---|---|---|
| LGW—BA | 7% | 6% |
| ZRH—SR | 8% | 7% |
| MAD—IB | 4% | 3% |
| MXP—AZ | 4% | 2% |
| BRU—SN | 5% | 5% |
| CPH--SK | 3% | 1% |
| FCO—AZ | 2% | 2% |
| VIE—OS | 2% | 1% |
| MUC—LH | 1% | 0% |
| Second Division | 36% | 28% |
Amsterdam’s unusual strength reflects decades of leadership in this segment, but its yields and profits suffered due to industry–wide overcapacity. No one in the Second Division has been unusually successful in attracting connecting flows to their hub.
How many Intercon hubs can Europe support?
The Swissair/Sabena study argued that all 14 hubs were viable and sustainable, but not if they followed the traditional flag–carrier business model and developed networks similar to and directly competitive with Frankfurt and Paris.
A carrier could operate longhaul from a European hub with a level of departures competitive with Frankfurt and Paris, or maintain a very limited service strictly supported by the local market similar to Austrian at Vienna or Alitalia’s downsized network at Rome, but there was no viable "inbetween" strategy.
The number of viable flag–carrier model Intercon Hubs is limited by the total pool of traffic from cities without non–stop service and the number of strong, immunised alliance with domestic US carriers. The North Atlantic accounts for 54% of the total longhaul market ex–Europe, and 20% of the US market can only be served in conjunction with an alliance partner. British Airways at Heathrow could clearly compete without an alliance partner (albeit at a slight disadvantage) as the larger UK–US market can support more direct service, but no continental hub could remain in the First Division without fully integrating North Atlantic networks with an immunised US partner.
While many observers at the time were expressing doubts, the study argued that there was no question about the about the ability of the market to support four large Intercon hubs, including Amsterdam. KLM’s smaller Home Market would always limit its potential profitability (relative to Paris or Frankfurt), but its decades of experience with hub and alliance management and other factors provided offsetting strengths, and it would clearly benefit from the inevitable shakeout of Sixth Freedom capacity.
There is no apparent need for consolidation within the First Division and any alliance or merger between these four hubs would have a huge impact on industry–wide competition. A merged British Airways–KLM would have had 45% of the Sixth Freedom Intercon market in 2000, more than double the share of Paris or Frankfurt.
The study argued that there was at least the possibility that the market could support a fifth Intercon hub, although this was by no means certain. 27% of the observed Sixth Freedom traffic already used Second Division hubs; a viable fifth flag–carrier hub would need to achieve a 10–15% share. More importantly, it needed to have a strong, immunised alliance with a US carrier (that was not allied with any of the four larger hubs) and achieve the same (or better) Sixth Freedom yields as the four larger hubs.
Could Swissair survive as Europe's fifth flag carrier Intercon hub?
It was readily accepted that Sabena had no business expanding its Intercon network, and the decision to double Sabena’s long–haul fleet from 10 to 20 aircraft (imposed by SAir Group in 1997 when effective control was acquired) needed to be totally reversed. None of the aircraft added had operated profitably. It was argued that Sabena could profitably support perhaps 8 to 12 long–haul aircraft, (the pre–SAir Group level) limited to large destinations such as New York and Boston, American Airlines hubs, and traditional markets in Francophone Africa. As will be discussed below, Sabena had a clear opportunity to abandon its Frankfurt–like approach, and to restructure along a "City Network" business model approach.
Swissair’s dilemma was much more difficult, as both growth and contraction seemed highly unattractive. The size of the Swiss market and the limitations of Zurich airport precluded any expansion towards the size of the First Division networks, but all evidence suggested that competitiveness would decline rapidly if Intercon service were cut back to a smaller scale. But 55% of all Swissair revenue came from Intercon traffic (versus 30% for Sabena) and Intercon was a huge percentage of Swissair’s asset and marketing base. Swissair operated 36 longhaul aircraft and only seven of these aircraft were operating unprofitably in 2000 and all but one was clearly cash positive. Swissair had a reputation for service quality that allowed it to compete successfully for higher–yield Sixth Freedom traffic against carriers with larger networks. In fact, the value of Swissair’s brand almost exclusively came from its ability to shift revenue share in competitive markets outside Europe. Swissair was respected within Europe, but (adjusted for stage length) its short–haul yields were exactly comparable to those of Sabena or Crossair, somewhat less famous brands.
The study concluded that there was no logical basis for arguing that Swissair could survive long term and earn reasonable returns, even if all of the conglomerate financial problems external to the airline could somehow be solved. If one were starting from a clean sheet of paper, one would never invest in a global hub based in Switzerland. The recommended approach, however, was to maintain Swissair’s 1999 level of Intercon operation and continue to try to compete directly with the First Division hubs, making maximum use of Swissair’s brand equity and service reputation.
Given the current profit squeeze and industry overcapacity, any expansion not clearly profitable would be cancelled, including the nine A340–600 aircraft on order which were much too large for Swissair’s markets. The A340–600 decision had been driven by conglomerate objectives (development of the aircraft leasing company) and without any reference to whether the aircraft could be operated profitably on the Swissair network.
Under 2000 conditions, introduction of the A340- 600s would have reduced Swissair profitability by over $72m per year. Profit recovery would depend on a rapid shakeout of other unprofitable Second Division Intercon capacity — not only a downsizing at Brussels, but also Gatwick and Malpensa, gauge reduction at Heathrow, and no new expansion at Copenhagen or Munich. It would also require strengthening the alliance with American Airlines to the level achieved with the previous alliance with Delta. Any BA–KLM merger, or US–UK open skies leading to a fully immunised BA–AA alliance would have destroyed the prospects for this approach.
The alternative most in line with the changing competitive situation was to downsize to a predominately short–haul network. This would have required the elimination of over 25 widebodies and replacing at least 20 of Swissair’s A320s with smaller aircraft due the loss of longhaul feed. It would have eliminated 80% of the jobs under the current Swissair pilot contract. The risks of such radical downsizing were huge and no airline in history had ever gone through a restructuring remotely similar. All current operations were cash positive yet any restructuring would have immediately drained cash and required massive new investment. While survival as the smallest of Europe’s First Division global hubs was highly uncertain, and many critical requirements were outside Swissair’s control, this was the company’s least risky near–term option.
The new SWISS Intercon strategy (2002)
Of course SAir Group refused to restructure any of its failed conglomerate investments and collapsed in 2001. SWISS became the successor company to Swissair, using the Crossair corporate structure, and acquired all of Swissair’s route authorities and other network operating assets.
As SWISS was not required to compensate the previous owners of these assets (the SAir Groupcreditors) it had the unusual freedom to establish whatever fleet or network mix it wanted.
The new owners of SWISS invested $2.5bn of new capital in a business plan whose centrepiece was an "in–between" size Intercon strategy. Zurich Intercon capacity was cut roughly 25 % (to a level similar to what Alitalia operated at Malpensa in 2000), and the historic Swissair brand name was abandoned. While they had the options of using their lower cost structure as the basis for maintaining Swissair’s full Intercon network, pursuing a predominately short–haul network based on regional aircraft, or a lower cost approach based on a narrower set of target markets, they chose instead to invest in a 26 aircraft long–haul strategy.
Thus the new owners of SWISS rejected all three of the major findings of the 2000 Swissair/Sabena study — that a short–haul regional aircraft based strategy was the best "clean sheet of paper" approach; that the largest feasible network and the strongest brand would be critical if one chose to continue to battle First Division hubs; and that an "in–between" Intercon network was the worst of all worlds, and was the least likely to achieve sustainable profits. Whether this alternative strategy can earn returns for the new investors is currently being tested in the marketplace.
A new City Network strategy for Brussels
The plan developed for Brussels abandoned key elements of the flag–carrier model, including the emphasis on rapid Intercon traffic growth and Sixth Freedom connecting traffic. Brussels is a large O&D market–similar in size to Rome, Milan, Munich, Zurich and a bit larger than Copenhagen and Vienna. The study argued that Brussels (and the other Second Division cities) were fully capable of supporting large levels of airline service, just not global hubs.
Of the 70 European cities Sabena and DAT served in 2001, 50 had fewer than 50 local Brussels passengers per day each way, and only six markets had more than 100 local passengers.
| >150 | 100-149 | 75-99 | 50-74 | 35-49 | 20-34 | <20 |
| 1 | 5 | 6 | 8 | 14 | 16 | 20 |
Thus an airline pursuing a Southwest or Ryanair type strategy of serving markets that can fill 150 seat aircraft would have difficulty developing a large network. The high cost of short–haul flights at Brussels–National Airport would make it difficult to profitably sustain the low fares that would be required to significantly stimulate new demand, and Brussels' appeal as a purely leisure destination is limited. Virgin Express has been unable to make money with its small route network.
Ryanair’s limited network is based at Charleroi (where its airport costs are essentially zero) and has not focused on traditional business destinations.
The recommended City Network business model, builds a high frequency network for these business destinations with a mixed, largely regional jet fleet, targeting a very small average gauge (75–90 seats) that reduces total ASKs.
Under 2000–01 market conditions, the study argued that Brussels could have supported 240- 280 flights, depending on the exact competitive situation. Seat capacity serving Sixth Freedom traffic would be drastically reduced, along with the marketing and sales infrastructure serving these diverse but low–yield markets. Long–haul and mainline narrowbody aircraft would be limited to markets that can be profitably operated with strong reliance on local traffic (London, Malaga, New York, francophone Africa). Global connectivity would have been provided in conjunction with alliance partners (Swissair and American).
Revenue would still be optimised with a hub schedule, but de–peaking the existing Intercon–oriented Sabena schedule would have provided utilisation gains enough to fund six or seven additional aircraft worth of flying.
Sabena - no chance to change direction
While Sabena management accepted the City Network recommendations, and worked actively to cut back longhaul flying and to significantly expand regional jet flying, it was unable implement the change in strategy. Sabena had grown at an annual rate of 22% between 1997 and 2000 — three times faster than the ruinous AEA 7% average rate that had destroyed billions in corporate value across Europe. The SAir Group strategy for Sabena was to focus on intra- Europe connect traffic, even though this was only 3% of industry revenue, and this traffic had no particular reason to choose Brussels over other, larger hubs. SAir Group’s 1997 decisions to recklessly over–expand, and to simultaneously replace Sabena’s entire fleet with aircraft much too large for its markets created impossible financial burdens and the company collapsed by the end of 2001.
In addition to doubling the long–haul fleet, SAir Group disposed of Sabena’s fleet of 32 Boeing 737s, (most of which were less than ten years old) replacing them with larger A320s. This would have increased the average gauge of Sabena’s overall narrowbody operation from 98 to 116 seats per departure, comparable to the level Air France operates in a local market three times the size of Brussels, where it also has 50 long–haul widebodies a day feeding connecting traffic onto those seats. The A320 is obviously a fine aircraft, it was just totally inappropriate for Sabena’s markets.
They would have increased annual costs by over $100m (since they are newer and larger aircraft) and would have been totally dependent on incremental Sixth Freedom traffic (on top of an already bloated base) to cover those costs. Because Airbus could not deliver this added capacity fast enough, SAir Group added wet–lease capacity from Virgin Express and CityBird at rates over $35m per year higher than Sabena’s own costs, under unbreakable multi–year contracts, which accelerated the cash drain and subsidised otherwise unsustainable competitors.
It would have been relatively simple to shift from Sabena’s 1998 fleet and network position to a City Network type strategy, but there was no way to quickly reverse the financial burdens of the SAir Group changes (fleet and wet–lease obligations, massive pilot retaining, overcapacity and yield declines, etc.). Press comment at the time Sabena shut down tended to focus on longstanding issues such as brand image, or Belgian social costs and industrial relations, but these factors had almost nothing to do with the immediate causes of its failure.
| AF-CDG | 120 |
| BRU after Airbus plan | 116 |
|---|---|
| SR-ZRH | 113 |
| BA-LGW | 110 |
| OS-VIE | 101 |
| BRU 1998 actual | 98 |
| KL-AMS | 93 |
| LH-MUC | 87 |
| BRU City Network plan | 85 |
While Sabena’s short–term profit outlook in 2000 was worse than Swissair’s, this was largely a function of the fleet and wet–lease problems.
SAir Group had made disastrous aircraft investments at both airlines, but they hit the Sabena P&L two years sooner. If one assumed these obligations could be restructured, and one looked out to the European airline environment of 2005 or 2010, the study suggested that it was more likely that one could operate a profitable City Network airline in Brussels than to make money in Zurich as the number five Global Hub in Europe.
While the 2000 Swissair/Sabena study argued that the Brussels market could support a large local–service airline, investors have been highly reluctant to step forward, and SN Brussels, the successor carrier remains under–capitalised.
As Sabena was not reorganised in an orderly manner, a large chunk of its previous revenue base was lost to foreign airlines, perhaps fatally undermining the potential opportunity. Or perhaps investors simply do not believe that any European airlines except the First Division global hubs and UK–based new entrants can justify new private investment.
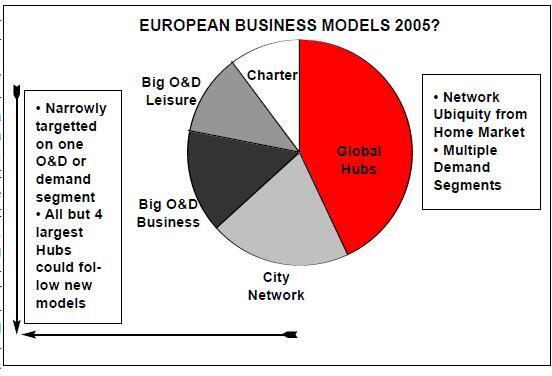
Three viable European airline business models for 2005
The central strategic question for European airline in 2005 is whether to pursue all possible sources of demand (global, domestic, short–haul European, mixed business and leisure) in order to maximise traffic volumes. If one does, one must incur much higher marketing infrastructure and operating complexity costs. These costs can only be offset by the scale economies of 747s and Frankfurt–type hubs, which can only be realised by carriers with large, sustainable Intercon networks.
The limited base of higher–yielding Home Market Intercon traffic suggests that only Heathrow, Charles de Gaulle, Frankfurt and Amsterdam can survive as Global Hubs, and thus only British Airways, Air France, Lufthansa and KLM have the possibility of pursuing a multiple demand segment strategy.
Long–haul service outside these hubs will survive only when the local market can fill at least half of the seats and local business travellers contribute a strong share of total revenue. But these carriers cannot follow the classic flag–carrier approach, as they can no longer assume domination of Home Market traffic except at the hub airport. British Airways has already lost a major chunk of UK traffic not firmly tied to Heathrow. Ryanair and easyJet have begun their attack on the German market, and easyJet and Buzz are preparing attacks on France.
Any European network that cannot enjoy the scale economies of a Global Hub must target a much narrower market segment, eliminate all costs not directly serving that target market, and achieve short–haul operating costs much lower than current British Airways or KLM levels.
While the restructuring process may be long and painful, it is unclear how any other hub can earn acceptable returns while continuing to follow a traditional flag–carrier approach. Two alternative business models offer shareholders greater potential. The City Network approach outlined earlier targets local intra–European business demand and drastically reduces capacity and operating costs by downsizing into smaller gauge, largely regional fleets. The Big O&D model uses a standardised fleet of larger (737/A320 type) single–class aircraft and then targets only those O&D markets large enough to fill these aircraft.
Three market approaches have emerged to date within the Big O&D sector. Big O&D carriers focusing on more traditional O&Ds (easyJet, Go, Ryanair in Dublin–regional UK markets), have the opportunity to exploit existing demand, which (as in the Ireland–regional UK case) may never be profitable or strategic for incumbent flag–carriers. Ryanair has already begun to develop a new segment with an air–only service to southern European leisure oriented destinations that have had little airline service in the past. Charter carriers have always focused on Big O&D markets, but are facing increased competition for leisure travellers and several are considering expanding into markets that not based on tour packaging.
These Business Models cannot be combined
Any sustainable airline must have lower costs than the flag–carriers of years past. But low cost is only one of the keys to sustainable profits, not an end in itself. Cost efficiency is driven by different factors under each model, and in each case certain costs must be added in order to generate critical revenue streams. An unfocused all–things–to–all–people management mentality is a major cause of inefficiency.
Without strategic clarity, managers cannot agree on which costs key to competitiveness and survival and which costs add very little value.
Because different costs play different strategic roles in each case, airlines cannot mix–and match elements of these models. The management approach of one model always undermines the unique cost discipline or market focus needed to succeed with the second model.
The discipline and skills needed to ruthlessly eliminate complexity and infrastructure costs in a City Network or Big O&D approach cannot also serve the diverse customer requirements of a Sixth Freedom hub. The focus on scale economies and complex automated tools that are key to Global Hubs cannot be readily applied to narrow local markets. Managers at Global Hub and City Network must carefully limit discretionary low–yield traffic to off–peak "fill–up" capacity, while managers at Big O&D carriers must build their marketing and capacity plans around these markets. Airline hubs,brands and companies must be rigidly linked to a single business model. It is certainly possible for shareholders to own different airlines in different sectors (with separate operations and bottom line accountability) as with the original British Airways–Go or current Lufthansa–Eurowings structure. It would also be possible for independent airlines to combine or jointly operate certain support functions, and this could be an important source of needed cost savings.
City Networks target existing traffic but have limited growth potential
The City Network model is designed to serve already existing demand for (relatively high priced) air service at (relatively high cost) major airports. This minimises market development costs but means that this model offers very limited traffic growth potential. Any carrier pursuing this model must abandon the rapid growth/scale economy thinking at the heart of the traditional flag–carrier model. Natural growth of the higher–yielding short–haul business revenue base is probably less than 2% per year, with no growth potential until the overcapacity of the late 90s has been worked off.
Only markets as large as the Second Division hub cities can support the multiple–frequency networks needed to make this approach work. City Networks at smaller cities (Geneva, Hamburg, Barcelona) are easily overwhelmed by large jet capacity from competitor hubs, and it is much more difficult to build the customer loyalty and competitive presence needed to maximise revenue performance.
This approach offers none of the glamour of a rapidly growing longhaul flag–carrier network, but that is not one of the options in a market like Brussels, Vienna or Rome. The City Network model offers an opportunity to make money the boring, old fashion way — by keeping costs in line with a more limited and stable revenue base, and maximising the satisfaction of local business travellers with a strong, reliable schedule.
The Big O&D model generates new demand but has difficult limitations
The biggest challenge facing Big O&D carriers is simply finding enough Big O&D markets that can fill large, growing fleets of 150–seat jets. Many of these markets are totally new, or were very poorly served by the traditional flag–carriers in the past. There are certainly large markets out there, but outside of London, they appear to be widely dispersed, may be slow to develop, and are not always situated near low–cost airports.
The growth potential of the Big O&D sector is further limited by difficult cost and competitive trade–offs. Carriers focusing on more traditional business oriented O&Ds (easyJet in Geneva- Amsterdam), must somehow establish a very strong price and cost advantage and stimulate much greater traffic volumes than the flag–carriers ever experienced, despite either serving higher cost airports or training the market to use less familiar alternative airports.
Development of new destinations, such as Ryanair’s services to airports such as Carcassonne or Pescara avoids direct competition, but will require rock–bottom costs. These new services will take customers from charter carriers, who may in turn move into more of these air–only leisure markets. While domestic O&Ds can be large, the small number of O&Ds in each country and high airport costs has prevented new entrants from achieving large, sustainable price and cost advantages. Given the inability of most Big O&D model new entrants to achieve profitability (Debonair, Virgin Express, Deutsche BA, Air Europa, etc) the challenge of these trade–offs should not be underestimated.
Despite superficial similarities, the European Big O&D model is not the classic Southwest Airlines model. Southwest pursues mainstream domestic business markets, with typical domestic aircraft on frequent schedules, so long as those markets are not at megahubs where the incumbent carrier would have overwhelming advantages.
European start–ups must develop totally new markets (Luton, Charleroi, Treviso, etc) with much larger gauge narrowbodies than the flag carriers use. America has many hundreds of non hub local markets with existing local demand that can support multiple 737 frequencies. With the exception of London (and possibly Paris) no European city appears able to support more than a handful of high–demand non–hub routes.
Southwest serves large traditional airports convenient for business travellers (Los Angeles, Phoenix, Detroit, St. Louis), while costs at the comparable European airports (Vienna, Zurich, Brussels) preclude Southwest type low costs.
Investors looking for Big O&D new entrants to replicate Southwest’s financial record — 25 years of double–digit growth at industry leading margins- will probably be disappointed.
The Big O&D model seems ill suited to capture much Second Division flag–carrier traffic, despite the financial and competitive vulnerability of these hubs. Big O&D carriers have failed to establish profitable operations to date in markets such as Brussels or Munich, and there is less reason to think they could succeed in cities such as Milan, or Vienna. While easyJet had clearly reduced the profits Swissair and British Airways had previously enjoyed on the London- Switzerland route, both incumbents remained profitable, and isolated easyJet services to Switzerland posed no threat to Swissair’s core Zurich hub or Swiss Home Market position. The subsequent collapse of Sabena and Swissair has not led to major Big O&D expansion in Belgium or Switzerland.
Second Division hubs have not moved away from the flag-carrier model
There is little evidence that the Second Division profit collapse that began in 1998 will be reversed, yet no carrier in the second tier has fully abandoned the flag–carrier thinking of the last twenty years. Each carrier has made positive moves, but none has coherently unified fleet, capacity growth, market focus, infrastructure cost and productivity improvements into a credible strategy.
Austrian long ago abandoned any global pretensions but still operates at a very high average gauge for the Vienna market (101 in 2000) and has had difficulties shifting from a 150–seat mainline jet to a Tyrolean/regional jet based focus.
SAS has reformed its capital structure and strengthened its Scandinavian Home Market position but has also spent heavily on increasing its already excessive narrowbody gauge and restoring Intercon capacity that it had previously decided was uncompetitive. Alitalia has come to grips with the inability of Italian airports to compete as Global Hubs, but has yet to realign its fleet or operating costs with a new strategy.
The only European hub currently following a City Network type approach is Lufthansa at Munich, where it operates only four long–haul flights, a heavy mix of regional aircraft, and achieves a European (cross–border) average 82 seats per aircraft, in line with the size of the local market (average seats on domestic German routes are slightly higher). 89% of the traffic Lufthansa carried at Munich in 1999 was German Home Market traffic. While the Munich hub may have been originally conceived with son–of- Frankfurt global ambitions, Lufthansa has sensibly avoided network shifts that would reduce the competitiveness of its major hub, while keeping Munich focused on profits, not glamorous routes and big aircraft.
While all of the second tier carriers face daunting political and industrial obstacles to serious restructuring, none have demonstrated the type of willingness British Airways and KLM have shown to take major action to address obvious problems of cost and overcapacity. The core, irreplaceable asset of each Second Division carrier is its historical Home Market revenue base, and its strong distribution and airport positions. The longer these carriers wait to bring capacity and infrastructure costs in line with the revenue potential of that core business, the greater the danger that the core will be irreparably damaged.
Alliances cannot save the Second Division carriers
While alliance membership may offer useful benefits to Second Division carriers, there is no evidence as yet that it addresses their strategic and financial problems in any meaningful way. Under certain conditions, alliances can strengthen an already secure network base, but they do not work in all markets, and they cannot turn a weak, marginal network into a profitable one.
The only alliances that have been big wins for both sets of shareholders are the immunised North Atlantic pairings, where two airlines with strong, sustainable "Home Continent" networks linked their hubs to capture competitive traffic flows they could not otherwise serve. There are no meaningful short–haul network synergies achievable from an alliance between two European hubs with heavily overlapping routes.
Incremental traffic captured by the Swissair- Sabena alliance was negligible. Alliances might serve to further dominate flows and increase yields between the two Home Markets, but the competition authorities might not accept this as a major benefit.
Full intra–European alliances (including joint sales and FFPs) can shift longhaul traffic but this tends to be in one direction only, with the Global Hub operator gaining share from the junior partner’s Home Market. It is completely sensible for SAS and Alitalia to abandon any Intercon capacity not largely serving local Scandinavian or Italian demand. But it is extremely difficult to design a pooling mechanism that will ensure that the benefits of diverting local revenue to Frankfurt or Paris will be shared equally by both the junior and senior partners. Air France can connect every important Italian airport to Charles de Gaulle without Alitalia’s help. While it makes sense for Air France to compensate Alitalia for incentivising its customers to fly via Paris instead of Frankfurt or Amsterdam, it is unclear how such payments could be large enough to cover Alitalia’s upcoming restructuring costs or guarantee the withdrawal of its competitive long–haul flying.
Cost and management synergies could be significant but require common ownership and control (as between Swissair and Sabena) and cannot be seriously exploited under an arms–length alliance. The consolidation of systems and functions that would drive meaningful savings requires loss of direct control and other risks that independent owners and managers rarely find acceptable.
The future depends on strategic clarity and cost management
With rare exceptions, European flag–carriers have never earned the cost of capital in liberal competitive environments. To do so in the future will require that carriers make a major cultural/paradigm shift away from flag–carrier thinking, refocus on one new business model, and ruthlessly manage costs in line with the chosen business model. The available hub markets and demand segments have long been defined; the challenge is establishing costs within the revenue base these customers are willing to pay. Consultants may peddle simple formulas for higher profits, (imitate Southwest’s fleet utilisation) just as they have in the past (imitate Frankfurt’s hub connectivity). But this review of industry economics, and the recent history of hub profitability and fleet, alliance and capacity growth decisions suggests that the most successful of the former flag–carriers in the coming decade will be the ones who most successfully restructure their costs.
The success new entrants such as Ryanair and easyJet have achieved to date largely reflects the fact that they began operations with both strategic clarity and extraordinary cost discipline, and none of the cost burdens of obsolete business models. But outside London, the Big O&D sector will face the challenge of developing new demand and new markets, as this model is not a direct substitute for the existing networks at hubs such as Amsterdam, Zurich or Milan.
Simple across–the–board cuts will not provide the cost savings the former flag–carriers require.
In addition to addressing long–recognised cost problems such as airport charges and operating work–rules, carriers must rethink the pieces of their network that are not part of their core Global or City Network hubs (such as the non–Heathrow parts of British Airways) that were marginal contributors in a protected flag–carrier world but are now the prime target of new entrants. Carriers must rethink their traditional approaches to fleet and capacity planning, as the fastest way to undermine profitability is a major fleet investment inappropriate for the airline’s markets. Despite recent problems at many carriers, these investments tend to receive very little outside scrutiny, and many assume that "fleet renewal" is always a profitable thing to do. Carriers must rethink their basic corporate structures and their need for independence and autonomy. A carrier must control its core network hub, and the safety of its operation, but any other function can be questioned.
Alliances should also be rethought, as many existing agreements fail to provide meaningful, measurable shareholder benefits.
Many existing airlines are financially weak, but European demand is inherently complex and fragmented, and a more efficient industry may still have a large number of operators and brands.
Mergers for mergers sake rarely benefit shareholders, and often make it more difficult to address cost problems.
But as Swissair and Sabena demonstrated, meaningful savings from consolidating management and key systems are possible without merging brands or unionised operating groups. New, innovative approaches to combining and managing airline functions could produce major productivity gains, but this will require challenging both longstanding flag carrier cross–border ownership and control constraints, and much local political and bureaucratic resistance.
The role of judicial reorganisation
At one level the destruction of Swissair and Sabena would seem to be an aberration, and one certainly expects that this level of financial mismanagement and willful disregard for basic airline economics will never be seen again.
But it has been proven that if a European airline has a serious competitive/financial problem and refuses to restructure its bad investments, it can fail. More importantly, if badly run airlines go bust, the service will not necessarily be replaced by other better run carriers, and the assets will not necessarily be moved to more productive uses. There was a tremendous amount of economic value within both Swissair and Sabena but most of that value was simply destroyed when they shut down. Industry efficiency has been seriously reduced, unless one believes that it would be impossible for anyone, under any business model, to operate a profitable airline network in Brussels or Zurich. That would only be true if there was also no justification for airline networks in cities such as Milan, Copenhagen, Madrid or Munich.
Letting badly run airlines undergo Chapter 11- type judicial reorganisation can serve the public interest in the US because the bankruptcy laws there ensure that airlines with viable core networks are not prematurely destroyed, and they provide an imperfect but largely workable mechanism for reallocating assets to more productive uses while protecting creditor rights and facilitating new investment. European bankruptcy laws are highly similar to US law on paper, but appear totally ineffective in the case of large airlines.
Aeropolitical constraints would have blocked any foreign company from attempting to take over the existing Swissair or Sabena positions. Slot control mechanisms make it impossible to establish a hub network position without acquiring all of the liabilities of the failing company. Judicial reorganisation could accelerate the restructuring needed at many flag–carriers. Without an effective restructuring process, billions of asset value and tens of thousands of viable jobs may be needlessly destroyed.
| 1996 | 1997 | 1998 | 1999 | |
| European GDP growth | 1.5% | 2.4% | 2.6% | 2.0% |
| AEA INTERCON | ||||
| ASK growth | 8.7% | 10.5% | 6.4% | 8.0% |
| RPK growth | 8.1% | 7.5% | 7.6% | 8.7% |
| Real RASK growth | (8.2%) | (5.5%) | (6.7%) | (8.5%) |
| AEAINTRA-EUROPE | ||||
| ASK growth | 6.4% | 7.7% | 10.0% | 5.5% |
| RPK growth | 7.3% | 5.3% | 7.9% | 5.8% |
| Real RASK growth | (6.8%) | (6.8%) | (3.8%) | (4.6%) |
| % of total Revenue | All markets | O&Ds with | Connect-only |
| base by O&D | nonstop | O&Ds | |
| category | service | ||
| Total | 100% | 65% | 35% |
| Intercontinental | 64% | 32% | 32% |
| Europe cross-border | 25% | 21% | 3% |
| Domestic | 11% | 11% | 0% |
| Sixth Freedom Traffic as % | ||
| of Total Hub Traffic (1999) | ||
| LHR—BA | 18% | |
| FRA—LH | 27% | |
| CDG—AF | 20% | |
| AMS—KL | 44% | |
| LGW—BA | 15% | |
| ZRH—SR | 34% | |
| MAD—IB | 7% | |
| MXP—AZ | 13% | |
| BRU—SN | 36% | |
| CPH- SK | 9% | |
| FCO—AZ | 2% | |
| VIE—OS | 24% | |
| MUC—LH | 11% | |
| Average of | 21% | |
| 13 hubs | ||