The manufacturers' market share game
September 1998

British Airways’ firm order at the end of August for 16 777–200/200ERs and 59 A320 family aircraft has ignited yet another round of market share claims from Airbus and Boeing.
The only certainty about the two companies’ respective claims is that they will differ. This is largely due to different definitions of what the market actually is. It is almost as though the last thing the manufacturers want to agree on is one simple definition through which real market share movement can be monitored.
But that is hardly surprising. Now that McDonnell Douglas has been swallowed up, the jet market largely consists of a straight fight between Boeing and Airbus. It’s essentially a zero–sum game now — every major A320 family order that Airbus wins is presented as a loss of 737 orders, and vice versa. And when market share is everything, the manufacturers are keen to present the current situation in the best possible light.
The best definition?
So if the manufacturers cannot agree themselves, just what is the best definition of market share? The most obvious one is orders. Virtually every order is accompanied by a raft of press releases by the manufacturer and airline concerned. However not all orders are announced, and analysts are faced with an “unannounced” total at the end of every year or half–year. Manufacturers are also keen to stretch the definition of a firm order — sometimes a “firm” order announced in an earlier accounting period is “reconfirmed” in the current period, for example. Also, the US Majors’ mega flexi–orders may distort the picture if they are all counted as firm in the year of announcement. Most significantly, neither manufacturers nor airlines tend to publicise order cancellations. Orders simply disappear from the overall manufacturer figures, making it almost impossible to keep an accurate track of the real situation.
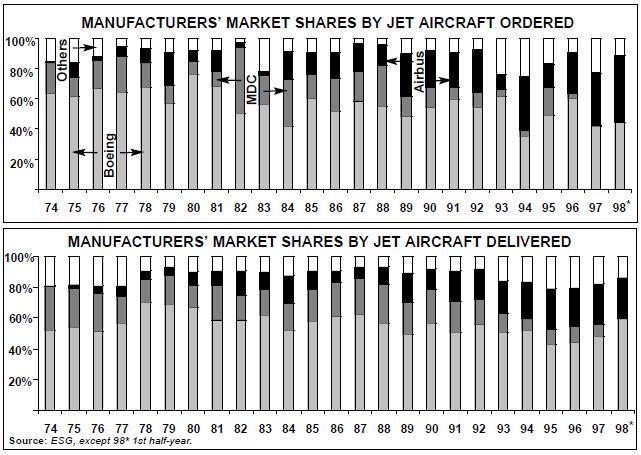
In addition to these problems, orders are simply too spiky. In terms of orders, Airbus had a great year in 1994 (36% of all jet orders), a poor 1995 (15%) and a good 1996 (27%). It is all too easy, for example, for Airbus to claim it has almost caught up with Boeing, only to see its order market share plunge the following year. In the first six months of 1998 Airbus won a greater share of jet orders than Boeing did, but with the above provisos that tells us relatively little about the manufacturers’ relative positions.
A much better measure, therefore, is deliveries. This not only eliminates cancelled orders, but also takes into account production rates (which are set by management depending on resources and order rates). As Boeing has found out to its cost, it’s no use having a large orderbook if you do not have the capability to churn out the products fast enough.
The delivery chart (left) reveals much smoother market share trends, and Airbus’s advance can be much more easily picked out. In 1997 Airbus accounted for 27% of jet aircraft delivered, and exactly the same proportion of provisional first–half 1998 deliveries. But Airbus still has some way to catch up with Boeing, which was responsible for 48% of jet deliveries in 1997 and 60% of the provisional first–half 1998 numbers.
Yet deliveries by unit is still an imprecise way of measuring market share, because it does not take into account the size of aircraft. This is where Boeing has a clear advantage, with the average size of its product range being larger than Airbus’s. Deliveries by number of seats would therefore be a better measure than aircraft units.
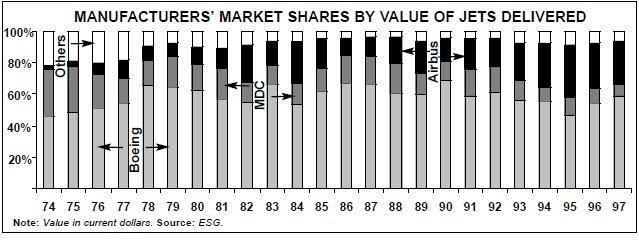
Another way of looking at this is to consider the monetary value of deliveries (order monetary value can be discounted because only deposits are paid up front). This is probably the fairest way of defining the market for jet aircraft, because larger aircraft obviously cost more. The main problem here though is discounting. The list prices published by Airbus and Boeing bear little resemblance to the prices actually paid by major customers placing large orders. In a situation where Boeing is directly “bidding” against Airbus for a large order, actual prices paid can be as much as 40% below list prices. BA’s A320 order, for example, was at a price reportedly around one–third below the list price.
That is why actual prices paid for deliveries (as estimated by ESG in the chart above) is the most accurate definition of market share. And this shows that over the last three years Airbus has actually been losing market share to Boeing (Airbus has 28.7% of the market by value of deliveries in 1997, compared with Boeing’s 58.6%).
Of course the most useful measure of all would be by profit on aircraft delivered. But we will have to wait until Airbus changes from a consortium to a company before Aviation Strategy can construct this market share chart.