Revenue/cost trends: what's happening?
September 1998


A review of the latest revenue and cost trends reveals some encouraging and some worrying trends on both sides of the Atlantic.
The data come from the quarterly reports of four major US carriers (American, Delta, Southwest and United) and three leading European airlines (BA, Lufthansa and KLM) — see Macro–trends, page 21, for details. The weighted unit revenue and costs are indexed to a 1990 base year. First–half 1998 numbers are provisional, and comparisons to the full year figures may be slightly misleading because of seasonal factors.
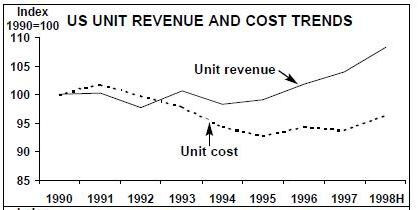
On the revenue side (see charts, above right) the most noticeable feature is the US carriers’ continuing success in keeping their yield and load factors up, reaping the benefits of controlling capacity growth and using revenue maximisation systems to their utmost.
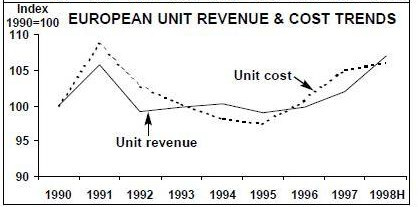
European unit revenues too are still increasing, albeit at a slower rate and driven by load factors rather than yields, which are stabilising or declining. Indeed, a 4% fall in British Airways’ yield in the second quarter of this year was seized upon by stock–market analysts, who turned bearish on the stock despite an overall improvement in profitability.
On the cost side, the European unit cost trend line is tracking very closely to the unit revenue line. As mentioned, above, because Aviation Strategy is reviewing just the first half of the year, the unit revenue and cost charts are exaggerating this trend. Nevertheless, this is a matter for concern. In the US, the unit revenue/unit cost gap has stopped diverging.
Fuel, labour and the rest
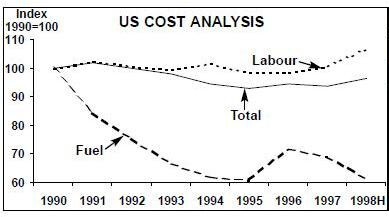
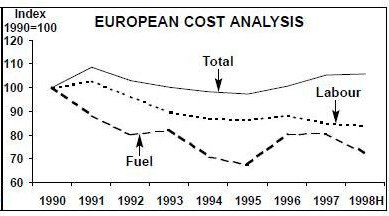
Looking in more detail at the components of operating costs (see charts, below), it is clear that airlines have enjoyed a big boost from cheap oil. Unit fuel costs (in actual terms) are currently 30–40% lower than they were in 1990.
This benefit will continue to filter through as jet kerosene prices have remained very depressed throughout the summer. In July 1998 spot prices — around 35 cents/US gallon in Europe and 37 cents in the US — were at levels that haven’t been seen since the mid–1970s.
Unfortunately, the oil market is due for a correction. At current crude prices, marginal production becomes uneconomic and oil companies run down their inventories. A fourth quarter rebound in fuel prices is on the cards.
On the labour front, US cost trends clearly show how the unions are now recovering some of the ground conceded in the early 1990s, either through snap–backs or new contracts. If the major US alliances are allowed to go through, expect the unions to absorb a significant proportion of the forecast synergy benefits.
By contrast, the European airlines are still stamping on labour costs. This success makes it all the more disappointing that European total unit costs are still drifting upwards. It looks as if it’s those infrastructure costs again.