The value of
airports
October 2018

What dictates the value of an airport? To answer this question investors require a good understanding of what drives passenger demand and airport profitability.
Revenues tend to grow at a rate comparable to growth in passenger traffic and so airport commercial viability typically depends on realising economies of scale. As a result smaller airports struggle — nearly half of Europe’s airports are loss making according to ACI. Indeed, if you just look at those airports handling less than 1 million passengers per annum, the proportion is even higher, at 76%. Net profit at these smaller airports averages minus 6% and return on capital invested averages minus 1.8%.
The overall health of the airport market is supported by around a third of airports making a solid return on investment. According to ACI the industry’s net profit margin is 22% with a global return on invested capital at 7.3%. As an asset class airports have a reputation as a relatively safe haven for large amounts of capital; attracting pension funds, banks, infrastructure suppliers and sovereign wealth funds looking to balance out their portfolio with large low risk investments. However not all airports are created equal and as with any other investment the risk incurred by investors depends on the financial health, growth strategy and market position of the airport in question.
Airport market position is largely driven by the economy of the surrounding area, its connectivity to other airports and how well it processes passengers and cargo. Anticipating future demand and deciding how this will be served dictates the investment required — creating a conflict between maximizing financial returns for investors on the one hand and improving the experience for passengers on the other. The following sections explore these drivers and the tensions between them.
Airports and passengers are prisoners of geography
Just as passengers often feel like there is no choice about which airport to fly from, airports do not choose their passenger catchment area and competitors. These are dictated by other airports and the local surface access infrastructure — primarily road and rail links. The size of the market itself depends on population affluence and propensity to fly.
The viability of competing modes or airports depends on the time and cost penalty involved for the passenger. While high speed rail can compete against aviation for journeys of up 4 hours, beyond this air transport is the only practical means of maintaining a frequent time efficient connection. Journey time can be driven by the sheer distances between ‘islands’ of conurbation (which underpins US Domestic demand), underdeveloped road/rail infrastructure (particularly true in South East Asia) or, as is the case with London, natural geographical barriers.
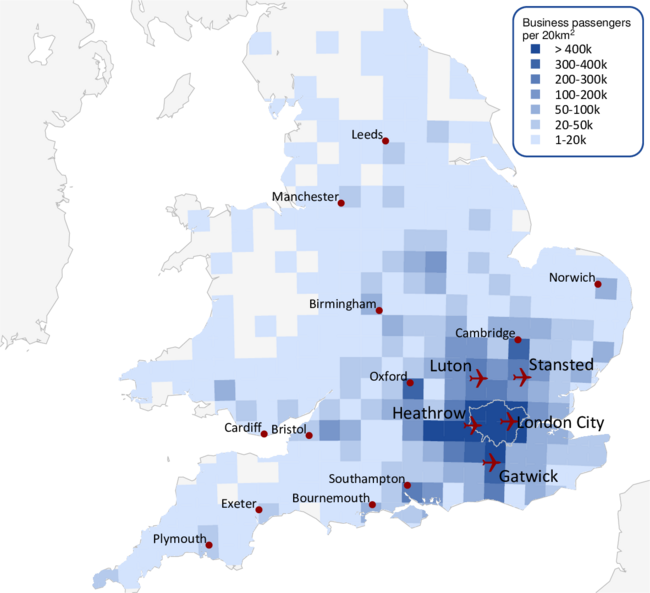
Indeed London is the largest single air transport market in the world, partly due to its confinement by the English Channel limiting terrestrial international transport links to the Channel Tunnel rail link or time-consuming Ferry routes.
Frequent, direct connections aggregate demand
Unsurprisingly airport choice is largely dictated by direct destinations its airlines fly to. This determinant (very important for time sensitive business passengers) is followed by fare price, travel time to the airport and departure time convenience, according to the UK CAA Passenger Survey. This can create a re-enforcing cycle; the more demand an airport can attract, the more direct connections it can support.
Connecting passengers are important at global hubs as they help to sustain connections which would otherwise be too thin, filling seats and improving profitability by providing a pool of flexible demand to supplement the local market. The market for connecting traffic depends on how well established an airport already is in the global transport network; requiring the presence of a network carrier with extensive hub and spoke operations. Global positioning of the airport is vital — global hubs need to be approximately equidistant from two strong O/D markets — consider the ‘super-connector’ Airports of the Middle East positioned between Australasia, CIS, Africa and Europe. Whilst airports’ global positioning can’t be changed, investment to facilitate transfers can be. Airport layout and infrastructure can also radically influence an airport’s viability as a hub as these drive the airport’s ability to provide short and reliable minimum connect times between aircraft. Thus while some cities will be natural homes for hubs even if the infrastructure is bad, and some will never make as hubs even if the infrastructure is good.
The aggregated demand of arriving, departing and connecting passengers dictates the number of destinations the airport connects to and the frequency with which it does so. The number of long-haul connections is a good ‘bell-weather’ for the health of intercontinental hubs and how well they tap into the relatively small pool of long-haul passengers — who make up just 12% of all those flying.
Know your market — from visiting friends to getting the latest iPhone…
According to IATA global supply chains deliver $5.5 trillion worth of goods by air every year, meeting consumer demand for products that may have their points of origin on the other side of the world. Industries driving globalisation are highly mobile relying on fast efficient and distributed networks to both design the product and deliver it to customers. An obvious example is the iPhone, along with other high-tech time-critical components such as aeroengines. Air cargo is also driven by perishable high value such as pharmaceuticals, luxury food and cut flowers.
Business travel is highly time sensitive and driven by industries hardwired into the global economy — such as IT, Financial and Professional services — who rely on aviation to connect talent and know-how with markets around the world. This is also true of industries that achieve operability or economies of scale by standardising technology or products to a global specification such as automotive, aerospace or engineering. Just as tertiary industries require access to a strong talent pool, primary industries require access raw materials, be they oil or precious metals, and these are often located in hard-to-get-to places. These industries are a key driver of transport demand for travel to, amongst others, Central Asian ’Stans, Sub-Saharan Africa and South America. Linking the workforce to labour markets generates significant business commuter traffic — accounting for some of the densest routes being flown such as CJU-GMP in Korea and FUK-HND in Japan.
Leisure travel is driven by the demand to visit Friends and Relatives (VFR) and tourism. VFR is underpinned by cultural connections and patterns of emigration with demand concentrated on national or religious holidays, while tourist demand prevails during seasonal vacations. Where such holidays lie in quarterly reports changes from year to year often makes direct performance comparisons difficult.
Airport competition
Airports compete with one another based on destinations served. Primary airports with good access to large, affluent (and typically urban) populations, and with the scale to support significant demand, tend to offer a greater number of connections, particularly to more expensive long-haul destinations. Secondary airports tend compete on price. For example the London short haul market is distributed between Luton, Stansted, Gatwick and City; dominated by low cost carriers meeting regional business and leisure demand. Increasingly ‘spilled’ demand from the constrained Heathrow hub is making more long haul connections from these airports viable.
In cases where competition is lacking, as when one hub dominates long haul routes, regulatory oversight may be needed if it is deemed that an airport holds significant market power. Such regulation has, to date, been rare and focused on maintaining fair and affordable airport charges for passengers (in Europe only Heathrow, Rome, Paris and Brussels are subject to price cap economic regulation). However recent developments are increasingly focusing on the passenger experience.
Airport investment is a delicate balance
Providing a better experience for passengers costs money. Airports are capital and labour intensive, with a high proportion of fixed costs and multi-year capital investment infrastructure improvements. For example Heathrow’s Terminal 5 was over 25 years in its planning, development and build — in the process setting the record for the longest public enquiry ever held. This supertanker-like agility requires airports to steer the right course early on — anticipating both the number of passengers they will process and what their expectations will be. Underinvestment will erode the passenger experience, risk the reputation of the airport and diminish connectivity as airlines cut services; over-investment will reduce the ROIC and risk creating under-utilised assets.
Ownership of airports
Ownership and management of airports is increasingly moving away from the public sector with around 500 airports now having some form of private sector participation in their ownerships. The drivers for the public budget are to provide receipts from airport sales and to facilitate infrastructure investment from private sources.
Governmental or local authority ownership continues for the smaller airports and investment incentives are provided by state or local authorities. However with airport capacity failing to keep pace with the continued strong growth air traffic in it is likely that we will see a greater proportion of these airports become viable in their own right. An empirical observation from the available data suggests the ‘magic number’ appears to approximately 1m passengers per annum. There are exceptions to this rule — Private Business airports, for example, have relatively low volumes of high yielding resilient passenger traffic — however this remains a very niche market.
In addition to realising economies of scale large airports have more geographically extensive route network. This exposure to a more diverse market provides them with a certain degree of financial resilience, even during global downturns, when it is likely that at least some economies will continue to grow. Their passenger markets are also likely to recover quicker — with confidence returning to high demand business orientated routes fastest partly due to a lack of alternatives.
Airports subject to economic price cap regulation have their allowable WACC set at the beginning of every regulatory cycle. This is typically determined by external benchmarking the appropriate cost of capital commensurate with the risk the investment represents to investors. A lower WACC implies a lower risk and reduces airport charges. However it reduces the attractiveness of the investment and capital investment may be delayed or cancelled, eroding the passenger experience.
This exposes a fundamental truth — airports cannot be everything to everyone and regulators must themselves take responsibility for plotting a middle course between affordability and a gold-plated passenger experience. As Douglas Adams pointed out there is no expression, in any language, for ‘as pretty as an airport’ — perhaps this is something we should accept.
Improving airport financial performance
Just as high load factors are desirable for airlines, higher asset utilisation for airports deliver a better return. Indeed once fix costs and planned capital investment commitments are met, additional demand incurs minimal additional operating cost. Airport profitability therefore depends on exploiting improvements against forecast. Airlines know this and use it as a strong lever to negotiate favourable airport charges — Ryanair often guarantees high growth in return for very low (or non-existent) aeronautical fees.
Income improvements can be achieved by growing demand or improving spend per head; good airport management should exceed expectations in both respects. Unsurprisingly airports focus on the latter — concentrating on optimising the mix of retail concessions. There are limits to this. An overly commercialised proposition erodes passenger experience and, can, counter-intuitively, decreases spend per head — after all happy passengers spend more. Knowledge of the passenger mix and management of terminal space is vital to tailor the offering appropriately. When done well it can lead to spectacular results — providing a world class shopping experience for those that want it and keeping it out of the way for those that do not. Indeed it is an airport terminal currently has the greatest spend per square meter of any retail space in Western Europe. It is also worth noting that as commercial revenues become more important to an airport, so its financial exposure to any downturn in passenger volume becomes ever greater.
A common denominator in the passenger experience is security and facilities management. To paraphrase Bill Clinton, the mantra of good airport management could be summarised as “it is the security queue, stupid”. This, along with the provision of other ‘Brilliant Basics’ including clean facilities, resilient operations, well-maintained light-filled buildings and working baggage systems (the Achilles heel of many airports), should be the focus. Only once these needs have been met should airport management worry about finessing its retail offering or premium products — be they specialist goods, lounge areas or priority security lanes. Although ‘magic bullets’ are hard to come by there are some examples — Gatwick recently upgraded its security processing using a novel lane design and new technology which both reduced passenger processing cost and improved customer experience. The size of an airport like Gatwick means that even relatively small improvements can scale to a significant increase in profitability.
Good cost control is vital to ensuring an airport is run efficiently — particularly when it comes to capital investment. There are huge opportunities for airports to improve this through better information management, especially when surveying for infrastructure improvements. Large airports must also be mindful of ‘false economies’; very aggressive cost control can destroy a supply chain, diminish quality, erode relationships and not save any money in the long run. Airports and their key suppliers must foster an atmosphere of respect and trust and strategic partnerships with key suppliers have been shown to yield good results in this respect.
Opportunities for growth
Where an airport’s prospects are recognised as integral to the region — such as in Hong Kong, Seoul or Singapore — a mindset of pursuing strategic growth prevails in public opinion, providing political capital for further expansion and investment. Where such support is more nuanced capacity constrained airports become highly skilled in managing the prevailing political consensus around their expansion. Key to this lies in developing plans and communicating arguments that simultaneously expound the economic benefits while illustrating how negative impacts around noise and air quality are mitigated against.
Conclusion
The value of an airport lies in its catchment area, air transport network connectivity and service proposition. For investors opportunities for growth should be understood, as should the robustness of the traffic forecast. For management marginal gains, particularly focused on ‘brilliant basics’ must be pursued to exceed expectations of both passenger and airport owner. Long-term airport strategy should focus on imaginative and collaborative means of nurturing future demand within the region.