Airline risk management strategies: fuel is not everything
October 2011

Airlines face six key financial and economic exposures – economic growth; crude oil prices; the jet–crude refining margin; exchange rates; inflation; and interest rates. Airline risk management strategies that attempt to reduce the impact of these exposures generally treat each exposure in isolation. Evidence suggests, however, that at least some of the six exposures are interdependent. In this article Tony Webber (see page 18) shows that a risk mitigation strategy which treats each exposure in isolation will be both more costly and, in all likelihood, less effective in mitigating risk than a risk strategy that considers inter–dependency.
He describes how airlines could reduce the amount spent on fuel hedging by taking into consideration the most important inter–dependency between exposures, specifically that between the price of oil and the exchange rate. He also shows that these cost savings can be achieved without compromising the ultimate objective of fuel hedging, which is to reduce P&L volatility.
Oil/FX interrelationship
When the oil price increases, most European currencies strengthen against the US dollar. As European airlines pay for jet fuel costs in US dollars, this positive relationship generates natural protection against higher oil prices for those airlines.
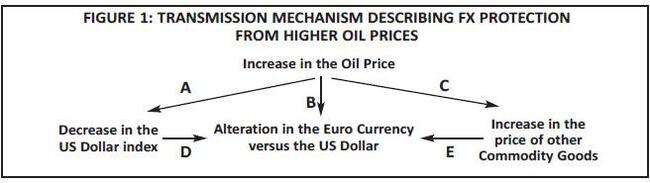
The degree of protection that the FX movement confers on European airlines depends on the size of three forces or elasticities – as shown in the diagram at the bottom of this page (Figure 1).
The first of the three forces is a combination of events A and D in Figure 1. Event A says that a higher oil price reduces the general value of the US dollar, as proxied by the US trade weighted index.
From the start of 2007 onwards, the daily price of oil and the US dollar is estimated to have shared a -86% correlation. Econometric modelling estimates that the elasticity between the oil price and the US trade weighted index is currently -0.22, meaning that each time the oil price increases by 10% the US trade weighted index falls by 2.2%.
The effect described as D in Figure 1 says that when the US trade weighted index falls, European currencies strengthen against the US dollar. Econometric modelling identifies the extent to which European currencies strengthen as the US dollar weakens, holding the influence of other variables fixed – refer to the estimates in Table 1 (page 15). The elasticities in Table 1 indicate that a 10% weaker US trade weighted index results in European currencies that strengthen against the US$ by as low as 8% (in the case of the GBP) to as high as 14.5% (the Danish Krone).
The product of the elasticities in this table (parameter D in Figure 1) and the -0.22 elasticity of the US trade weighted index to the oil price (parameter A) determines the first component of the impact of the oil price on European currencies.The second component of the impact is described by event B in Figure 1. Event B says that an increase in the oil price has a direct impact on European US$ currencies.
The sign and magnitude of this direct impact depends on whether the European country in question is a net importer or exporter of oil and energy – net exporters are likely to experience a positive elasticity.
The results of econometric modelling suggest the direct oil impacts described in Table 2, (see below).
Table 2 indicates that the direct effect on European currencies of the oil price varies from as low as -0.13 (Danish Krone), to as high as +0.13 (Norwegian Krone). The Danish and Norwegian Kroner estimates suggest that a 10% increase in the oil price leads to a 1.3% reduction and increase in the Danish and Norwegian currencies respectively.
Relative to the indirect oil/FX relationship described by arrows A and D in Figure 1, the direct impact appears to be relatively small. Indeed for most currencies (Danish and Norwegian Kroner being exceptions) the direct effect is close enough to zero to be rendered zero.
The final relationship between the oil price and the US Dollar exchange rates involves a combination of events C and E in the transmission mechanism diagram (Figure 1, again). These events indicate that an increase in the oil price coincides with an increase in other commodity prices, which in turn results in a stronger currency. These effects are not found to be statistically significant in the case of the European currencies examined.
FX/Oil correlation to reduce hedging: Fuel Cost Offset
European airline fuel hedging can be reduced by a percentage that is equal to the amount of fuel cost protection that an airline enjoys as a result of its home currency strengthening when the oil price increases. This FX protection can be calculated by using the following formula:
Each of the components of this formula have been estimated and presented in the two elasticity tables (Tables 1 and 2). If we substitute this estimated information into the formula we obtain the estimated fuel cost protection from the FX/oil price correlation – see Table 3, right. The table indicates that airlines domiciled in Norway need only hedge 59% of their jet fuel consumption because of the 41% natural fuel cost protection they receive from a stronger Norwegian Krone when the oil price increases. Conversely, airlines domiciled in Euro countries must set fuel hedges much higher at 82%.
FX/Oil correlation to reduce hedging: Other costs
The FX fuel cost protection described above is not the only protection that European airlines enjoy as a result of stronger exchange rate in a high oil price environment. They also enjoy lower non fuel unit costs. The types of non–fuel airline costs that decline in response to a stronger currency include:
- foreign airport costs;
- aircraft purchase costs;
- aircraft operating leases;
- aircraft spare parts; and
- servicing foreign currency denominated debt.
A stronger currency also results in lower foreign point of sale revenue by virtue of translation effects. This adverse revenue impact must be offset against a favourable non–fuel unit cost effect when determining the extent of net FX protection.
There is a formula that allows us to determine the extent to which fuel hedging can be reduced because of the FX protection provided to non–fuel costs net of revenue effects. This formula says the degree of FX protection is equal to the following: To illustrate how this formula is used we assume the following parameter values:
- Non–Fuel costs denominated in US$ as % total cost = 55%;
- Fuel costs as % total cost = 15%;
- Foreign point of sale revenue as % total revenue = 45%; and
- Ratio of European Currency Jet Fuel Costs to revenue = 17%.
If we substitute these numbers into the above formula and combine this with the estimates contained in Tables 3 and 4 (see right) we obtain the additional FX protection that European airlines enjoy. Table 4 indicates that the degree of additional FX protection from higher oil prices varies between 19% in the case of Euro–zone countries up to 41% for Norwegian carriers.
If we add the entries in Tables 3 and 4 together, this yields the extent to which European airlines can reduce their fuel hedging as a result of total FX protection.
The estimated amount of fuel hedging in which European airlines should engage after taking into consideration FX protection is presented in Table 5 (below). This table indicates that Euro–zone and Danish airlines should be relatively highly hedged and Norwegian and Swedish airlines should have relatively low fuel hedging levels. UK airlines should have hedge levels of around 50%.
Hedging or operational levers?
The fuel hedge percentages presented in the Table 5 represent the percentage of jet fuel consumption that should be hedged to account for the residual exposure to higher oil prices after taking into consideration FX protection.
The risks associated with this residual exposure can be minimised, ex ante, by using financial instruments such as swaps, options and collars or, ex post, by using operational levers such as fuel surcharges, higher base prices and capacity reduction. Most airlines tend to use a combination of both financial instruments and operational levers to hedge against this residual exposure.
In an environment in which the oil price cycles around an upward trend, which has been the case since early 2000, financial instruments will only delay the onset of higher oil prices. This is because hedge contracts must be re–set at higher strikes or swap prices. This delay buys the airline time to determine how it should operationally respond to higher oil prices. If the cycle around the upward trend is volatile, the price paid for buying this time can be extremely expensive (at the money call options exceeded US$20 per barrel just prior to the GFC).
Hedging using financial instruments also carries risk. While the use of financial instruments delays the exposure to the spot price, it introduces new risks related to choosing the right instrument; the right product (WTI or Brent); and the right timing (how far out to hedge). These are difficult decisions that can cost the airline an enormous amount of money if made incorrectly.
For example, an airline may use swaps to lock in an oil price of $80 for the next six months only to see spooked global financial markets drive the spot price of oil down by US$20 over that period, generating substantial hedge losses that must be taken to the P&L.
The cost of using financial instruments together with the additional risks that they carry has driven many carriers to increasingly use operational levers as defence against the residual exposure to oil.
When used properly, operational levers can be highly successful devices in the fight against higher oil prices. The first step in their proper use, however, is an acceptance that higher oil prices will deliver lower profitability, no matter what operational levers are pulled. Airlines often live in oil denial – they believe that raising prices by an amount that is equal to the increase in unit fuel costs will deliver an oil–unaffected profit outcome.
The second step in determining the most effective use of operational levers is to understand how pricing and capacity decisions impact profitability. The reason operational levers are being flexed in response to higher oil prices is because there is a belief that doing so will result in a better profit performance than doing nothing. To support this belief, airlines must understand how changing operational levers affects profitability.
This understanding depends on the following critical parameters:
- the sensitivity of passenger demand to a change in own price (we will call this parameter A);
- the sensitivity of yield to a change in own and competitor capacity (parameter B);
- the impact on (passenger driven) costs of a change in load factors (parameter C); and
- the impact on costs of a change in capacity (parameter D).
It is only when the airline has estimates of these parameters that it can make an informed assessment of whether imposing fuel surcharges or reducing capacity will improve profitability relative to a do nothing situation.
For example, suppose an airline increases its fuel surcharges, without altering capacity, in response to an increase in oil prices. This leads to a reduction in passenger demand that is determined by parameter A. The size of parameter A depends on two forces – the extent of competitor follow (i.e. whether competitors also raise fuel surcharges) and the financial confidence of consumers (the stronger the financial confidence the more resilient demand will be to price). The reduction in demand will lead to a reduction in those costs that are driven by passenger volumes, as described by parameter C. Airline revenue can either increase or decrease – the greater is the size of parameter A (the elasticity of demand) the more likely it is that revenue will fall. As long as passenger driven costs fall by more than revenue falls then profitability increases and the airline is better off increasing fuel surcharges compared to a do nothing response.
Suppose now that an airline decides to reduce its capacity compared to planned levels in response to higher oil prices. This leads to a reduction in costs that vary with capacity, as described by parameter D.
Revenue will fall in response to lower capacity, with the size of the fall dependent on the extent to which yields rise in response to a reduction in capacity (parameter B). The size of B depends on whether competitor airlines follow or steal – they follow if they also reduce capacity and they steal if they decide to expand capacity. Profitability rises, and thus a strategy of capacity reduction is superior to the do nothing case, when costs fall by more than revenue.
Operational responses to higher oil prices are therefore complex. The profit maximising response will depend on the ability of the airline to gain access to information about critical parameters. These critical parameters are in the airline data somewhere, however it takes significant expertise and airline experience for it to be retrieved and properly used and communicated.
| Elasticity Value Past Six Months | Interpretation of Elasticity | |
|---|---|---|
| Euro | -0.84 | A 10 % Weaker US dollar leads to a 8.4% stronger Euro against the US dollar |
| GB Pound | -0.80 | A 10 % Weaker US dollar leads to a 7.7% stronger GB Pound against the US dollar |
| Swiss Franc | -1.25 | A 10 % Weaker US dollar leads to a 12.5% stronger Swiss Franc against the US dollar |
| Swedish Krona | -1.42 | A 10 % Weaker US dollar leads to a 14.2% stronger Swedish Krona against the US dollar |
| Norwegian Krone | -1.19 | A 10 % Weaker US dollar leads to a 11.9% stronger Norwegian Krone against the US dollar |
| Danish Krone | -1.45 | A 10 % Weaker US dollar leads to a 14.5% stronger Danish Krone against the US dollar |
| Elasticity Value | Interpretation of Elasticity | ||||
| Past Six Months | |||||
| Euro | 0 | A 10 % Increase in the US dollar Brent Price has no | |||
| direct effect on the Euro against the US dollar | |||||
| GB Pound | +0.06 | A 10 % Increase in the US dollar Brent Price leads to a | |||
| 0.6% | stronger GB Pound against the US dollar | ||||
| Swiss Franc | +0.02 | A 10 % Increase in the US dollar Brent Price leads to a | |||
| 0.2% | stronger Swiss Franc against the US dollar | ||||
| Swedish Krona | -0.01 | A 10 % Increase in the US dollar Brent Price leads to a | |||
| 0.1% | weaker Swedish Krona against the US dollar | ||||
| Norwegian Krone | +0.13 | A 10 % Increase in the US dollar Brent Price leads to a | |||
| 1.3% | stronger Norwegian Krone against the US dollar | ||||
| Danish Krone | -0.13 | A 10 % Increase in the US dollar Brent Price leads to a | |||
| 1.3% | weaker Danish Krone against the US dollar | ||||
| Euro | 18% | |
| Danish Krone | 18% | |
| GB Pound | 24% | |
| Swiss Franc | 28% | |
| Swedish Krona | 32% | |
| Norwegian Krone | 41% | |
| Euro | 19% | |
| Danish Krone | 19% | |
| GB Pound | 24% | |
| Swiss Franc | 28% | |
| Swedish Krona | 33% | |
| Norwegian Krone | 41% | |
| Euro | 63.0% | |
| Danish Krone | 62.9% | |
| Great British Pound | 52.2% | |
| Swiss Franc | 43.9% | |
| Swedish Krona | 35.2% | |
| Norwegian Krone | 18.0% | |