Global economy: A matter of imbalances
October 2011

In the immediate aftermath of the Lehman Bros' collapse in late 2008, when banks stopped moving money, and the world’s economy came to an abrupt halt, the main concerns revolved round the shape of the looming global economic recession; V–shaped, Ushaped, double–dip W–shaped or – in the words of one noted commentator – bath–tub shaped. Three years on from that shock to the global system we now know that there has been a recovery – of sorts. The recession took its full force in 2009 with a reduction in world GDP of some 0.7% (and a near 4% fall in the advanced economies); the inevitable bounce back in 2010 saw increases in global GDP of some 5% — and growth resumed in all but a handful of minor states. The early signs for this year were for continued recovery albeit at slightly lower growth rates than in 2010.
However, since the beginning of the year the economic environment appears to have been deteriorating. Admittedly there have been one–off shocks to the system: the earthquake and after–effects of the consequent tsunami in Japan are estimated to have reduced global economic activity by a noticeable proportion in the second quarter (with some estimates suggesting that global car production was down by around 30% because of the impact on the supply chain, and others suggesting that output in the advanced economies had been reduced by 0.5%-1% in the second quarter as a direct result of the disaster). The disturbances in the Middle East and North Africa following the Jasmine revolution had a significant impact on oil prices because of fears of supply restrictions (and possibly a knock–on effect on other commodities) – and as the price once more edged up over $120/bbl some aviation commentators suggested invidious comparisons with the events of 2008.
Many commentators and forecasters have been downgrading short term expectations. The IMF, in its latest World Economic Outlook bulletin published in September, further shaved its estimates for world GDP growth this year by around half a percentage point for most regions of the world (see table, above). On top of this however it emphasised increasing downside risks to its medium term forecasts; and that this risk seemed to be accelerating.
It is all perhaps a matter of imbalances.
The two–speed economic pattern of the 2000s saw reasonable growth in the developed world unusually in conjunction with strong growth in the BRICs. This has been exacerbated through the financial crisis.
The developing nations – led by China paramount among the BRICs — continue to expand (albeit generally at a slightly slower rate than in the pre–crisis period) but the developed economies (which account for half the world’s economic activity but three quarters of the world consumption) remain very sluggish.
Through this year in fact, the growth in the developed nations has been much slower than expected – levels of unemployment remain stubbornly high, consumer confidence low, and fiscal tightening has not been replaced by consumer spending (hardly surprising perhaps when household debt ratios continue at high levels and house prices in those countries most responsible for the asset bubble remain badly subdued), and savings ratios have continued to rise where possible.
On top of this, the fiscal austerity measures necessary in most developed nations to recover fiscal confidence are adding to consumer concerns, further reducing consumer confidence and weakening spending propensity; effectively producing a downward feed–back loop.
However, in the developing nations there are increasing concerns of the possibility of economic overheating and the dangers of raised inflation expectations; and food price inflation is one of the major concerns (food accounts for an average of about 30% of consumer spending in the developing world against around 17% in the developed).
In addition to all of this are the increasing financial and fiscal uncertainties – highlighted by the problems in the peripheral Euro countries of Greece, Portugal, and Spain, but also represented by the budgetary problems in the US.
In conjunction with the tightened capital requirements of the new banking order these appear to be leading major banking institutions once again to question the financial stability of other banks: perhaps suggesting that inter–bank lending and global monetary flows are again under pressure (which was possibly a major contributing factor to the halt in the world economy in 2008/9). At least the reintroduction of another round of quantitative easing by the Bank of England seems to suggest a concern in that direction; and there will possibly be increasing pressure on other central banks to take similar action. There is a parallel in the aircraft finance sector where the Export Credit Agencies (ECAs) have been obliged to fill the gaps left by exiting commercial banks. Pre 2008, ECAs, according to DVB Bank, accounted for about 20% of new aircraft financing, but that proportion has now risen to about 35%. The retreat from aviation financing has accelerated in recent months; the question is whether this retreat is tactical and temporary or strategic and permanent.
Mixed aviation recovery
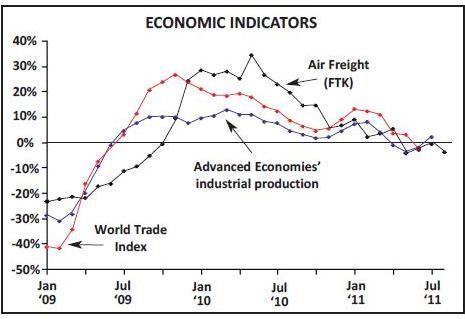
Meanwhile there are once again mixed signs emerging from the aviation industry. Total international freight tonne kilometres have been exhibiting modest year–on–year declines since May this year having experienced a significant recovery in the restocking cycle in 2010/11. Freight traffic does tend to be a coincident if not leading indicator of economic activity and appears closely linked with world trade activity and industrial production (see chart, above). Air freight volumes however are also weighted towards a traditional pre–Christmas peak; the major consumption period in the developed nations' economies. Further disturbing news recently came from both Lufthansa and Cathay (the world’s largest and third largest airline freight operators respectively). Cathay highlighted a 10% decline in freight traffic in September blaming slowing Chinese exports; both Cathay and Lufthansa suggested that there were no signs of the usual fourth quarter demand peak.
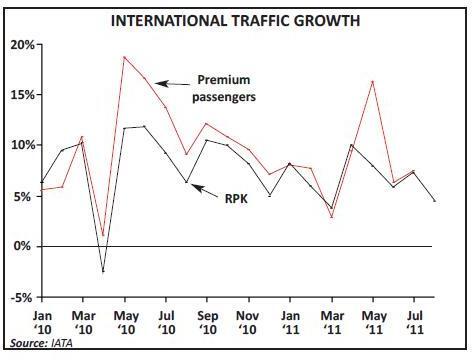
On the other hand, the latest figures we have from IATA (albeit for July) show continued year–on–year improvements in premium passenger demand – and generally at a higher rate than total traffic growth in RPKs (see chart, page 1); but then perhaps passenger traffic is more naturally a lagging indicator.
The questions posed in 2008–09 are probably still valid; the shape of the recession and recovery is still not certain. The IMF WEO suggests that should all the negative risks manifest themselves we could indeed be looking at the second stage of a double dip recession in 2012 for the major industrialised nations; and that the developing nations (especially in Asia) could also encounter a hard landing.
| Previous | Previous | Downside | Downside | |||||
| 2009 | 2010 | 2011P | estimate | 2012P | estimate | 1 | 2 | |
| World Output | -0.7 | 5.1 | 4.0 | 4.3 | 4.0 | 4.5 | 2.2 | 1.5 |
| Advanced Economies | -3.7 | 3.1 | 1.6 | 2.2 | 1.9 | 2.6 | ||
| United States | -3.5 | 3.0 | 1.5 | 2.5 | 1.8 | 2.7 | -0.5 | -1.5 |
| Euro Area | -4.3 | 1.8 | 1.6 | 2.0 | 1.1 | 1.7 | -2.3 | -2.5 |
| Germany | -5.1 | 3.6 | 2.7 | 3.2 | 1.3 | 2.0 | ||
| France | -2.6 | 1.4 | 1.7 | 2.1 | 1.4 | 1.9 | ||
| Italy | -5.2 | 1.3 | 0.6 | 1.0 | 0.3 | 1.3 | ||
| Spain | -3.7 | -0.1 | 0.8 | 0.8 | 1.1 | 1.6 | ||
| Japan | -6.3 | 4.0 | -0.5 | -0.7 | 2.3 | 2.9 | 0.9 | 0.5 |
| UK | -4.9 | 1.4 | 1.1 | 1.5 | 1.6 | 2.3 | ||
| Canada | -2.8 | 3.2 | 2.1 | 2.9 | 1.9 | 2.6 | ||
| Other Advanced Economies | -1.1 | 5.8 | 3.6 | 4.0 | 3.7 | 3.8 | ||
| Newly Industrialised Asian Economies | -0.7 | 8.4 | 4.7 | 5.1 | 4.5 | 4.5 | ||
| Emerging and Developing Economies | 2.8 | 7.3 | 6.4 | 6.6 | 6.1 | 6.4 | ||
| Central and Eastern Europe | -3.6 | 4.5 | 4.3 | 5.3 | 2.7 | 3.2 | ||
| CIS | -6.4 | 4.6 | 4.6 | 5.1 | 4.4 | 4.7 | ||
| Developing Asia | 7.2 | 9.5 | 8.2 | 8.4 | 8.0 | 8.4 | 6.2 | 5.4 |
| China | 9.2 | 10.3 | 9.5 | 9.6 | 9.0 | 9.5 | ||
| India | 6.8 | 10.1 | 7.8 | 8.2 | 7.5 | 7.8 | ||
| ASEAN-54 | 1.7 | 6.9 | 5.3 | 5.4 | 5.6 | 5.7 | ||
| Latin America and the Caribbean | -1.7 | 6.1 | 4.5 | 4.6 | 4.0 | 4.1 | 3.2 | 3.1 |
| Brazil | -0.6 | 7.5 | 3.8 | 4.1 | 3.6 | 3.6 | ||
| Mexico | -6.2 | 5.4 | 3.8 | 4.7 | 3.6 | 4.0 | ||
| Middle East and North Africa | 2.6 | 4.4 | 4.0 | 4.2 | 3.6 | 4.4 | ||
| Sub-Saharan Africa | 2.8 | 5.4 | 5.2 | 5.5 | 5.8 | 5.9 |