What the stock-markets are saying
October 2010

The airline industry is in recovery from the worst recession in its history. It must be so. The data from individual airlines and from the industry associations shows very strong improvements in traffic and yields (see last month’s Aviation Strategy). Global traffic levels have returned to the peak levels seen in 2008. Premium cabins — the bedrock of long–haul profitability — have, according to IATA, seen year–on–year percentage growth in passenger numbers (at least on long–haul services) sufficient to suggest that the demand is really recovering from the halt in the world economy that appeared after the collapse of Lehman Bros at the tail end of 2008. In 2009 the global industry saw passenger yields slump by an unprecedented 13% — so it should hardly be surprising that individual airlines are reporting substantial improvements in traffic yields and total revenues as we go through the rebound. IATA keeps on upgrading its forecasts for the global industry profitability. We are definitely on an uptrend and the consensus seems to suggest a recovery leading to a peak of the current cycle by 2013/14 at least.
Have the financial markets taken this totally on board? Airlines are not a “must–have” sector for most investors. Accounting for less than 2% of global market equity capitalisation (albeit accounting for a far higher overall proportion of global GDP), one can perhaps understand that any airline investment may be treated as a marginal choice by most professional investors. The airline industry encompasses two basic seemingly incompatible economic fundamentals — it is highly capital intensive and the product itself has a very short shelf life. Revenue is a function of demand and price; in the upturn demand is sufficient to absorb almost any price increase; in the downturn the price is never sufficient to catch the falling demand. Given this operational gearing it may hardly be surprising to see that the airline share prices have high betas and display significant volatility in comparison with the underlying stock markets.
The operational peak of the last industry cycle appears to have occurred in the first half of 2008. Stock markets, with their usual prescience, provided peak share prices during the first half of 2007 (and not just for airlines). The old rule of thumb had been that in the downturn of the airline industry share prices would halve (only to double again in the upturn): but in this financial crisis and global recession, stock markets also halved in value and the airlines were hit even harder (almost as hard as the banks themselves). In the sample of carriers shown in the table on page 3 these declines averaged 75% from peak — although the share prices of those such as American, United and GOL fell by more than 90%; BA, Air France and Delta by more than 80%; and even easyJet, Ryanair and Southwest, let alone Lufthansa and Iberia, by around 70%.
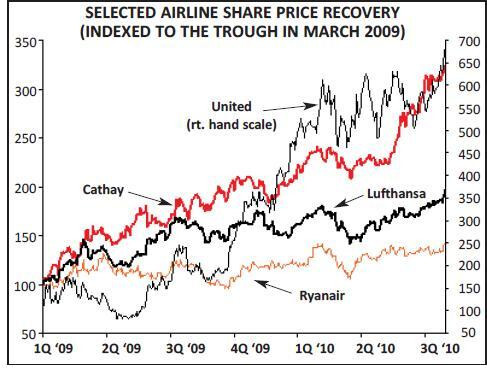
The markets touched their nadir in March 2009 at the depths of the level of economic confidence and have at least bounced back reasonably strongly. The London market as a whole — beset even by the woes in the UK economy and despite the weakness in sterling — has recovered (albeit as if on a roller–coaster through the summer) to a point where the FTSE 100 index stands a mere 16% below the peak of 2007. This sample of airlines have seen their shares recover strongly — on averaging trebling from the trough. Some of those that were particularly badly hit in the downturn have recovered faster as one might expect — with United’s share price in particular increasing eightfold (alright — it did do the long awaited deal with Continental) and that of GOL by six–fold.
Some of the recovery euphoria did not quite last the full year 2009 results season and the likes of American, Delta, Air Berlin and Vueling have seen their share prices fall by around 35% from peaks achieved in spring of this year. Most of the others are now only a few points below the early year peaks — while four notable exceptions (Cathay, United, Lufthansa and Ryanair, see graph on page 1) are at their highs of this recovery period. Most are still at half the value they achieved in the peak of the last cycle; the two major exceptions being Cathay and Air Asia — respectively 2% and 3% above the highs achieved in 2007.
Those two may be the anomalies; but reflect the current euphoric trading conditions in China and the Far East in comparison with the continuing slow and haltering developments in economies in Europe and the US — pointing if anything to the two–tone nature of the economic recovery with the developing nations leading the way — (although interestingly SIA is still 20% below the 2007 peak). In addition there are still doubts of the shape of this recovery in the developed economies; and with the need of many governments to unwind their fiscal deficits there are fears that too rapid a reduction in government spending will stifle the potential growth and bring on a double–dip recession in 2011.
The table opposite attempts to tabulate this and shows the share price performance of a select group of quoted airlines (all data in local currency units). The first column picks up the high value achieved in the last cycle — the timing for which varies for each individual carrier but generally took place during 2007. The second column shows the low point achieved (mostly in March 2009) at the bottom of the market dive; the third shows the percentage change from the high in 2007 to the low in 2009 (P–T). The fourth and subsequent columns pertain to data since that low point; the recent peak refers to highest share price level achieved since the low in 2009 and the fifth column is the absolute percentage increase from the low point (T–P). The sixth column reflects the closing share price on Oct 8 and the seventh (P–C) shows the percentage fall from that recent peak. A value of zero in that column means that the current share price is at the high. The final column shows how far below (or, rarely, above) the peak share price in the last cycle shown in column 2. For market comparison we include the same data for the FTSE, Hang Seng and S&P 500 indices in the last three rows.
There has been strong airline share price performance since the depths of the recession (some brave investors could have made a small fortune) and there may appear to be further good upside as we move through this new airline cycle; but, as it says on the packet, shares can go down as well as up.
| Last Cycle | Recovery – Current Cycle | |||||||
|---|---|---|---|---|---|---|---|---|
| Peak (2007) | Trough (late 2008/early 2009) | P-T | Recent Peak | T-P | Current (8/10/10) | P-C | Current/Last Cycle Peak | |
| Air Berlin | 20.42 | 2.63 | -87% | 4.49 | 71% | 3.1 | -31% | -85% |
| Air France/KLM | 38.3 | 6.36 | -83% | 12.88 | 103% | 11.84 | -8% | -69% |
| AirAsia | 2.11 | 0.79 | -63% | 2.25 | 185% | 2.17 | -4% | 3% |
| American | 40.66 | 2.54 | -94% | 10.16 | 300% | 6.35 | -38% | -84% |
| BA | 577.5 | 109.9 | -81% | 266.1 | 142% | 264.2 | -1% | -54% |
| Cathay | 21.73 | 6.82 | -69% | 22.1 | 224% | 22.1 | 0% | 2% |
| Delta | 22.79 | 3.93 | -83% | 14.93 | 280% | 11.4 | -24% | -50% |
| easyJet | 732 | 220.25 | -70% | 496.5 | 125% | 451.6 | -9% | -38% |
| GOL | 38.3 | 2.79 | -93% | 17.23 | 518% | 17.23 | 0% | -55% |
| Iberia | 4.11 | 1.25 | -70% | 3.06 | 145% | 3.04 | -1% | -26% |
| Lufthansa | 22.62 | 7.3 | -68% | 14.33 | 96% | 14.33 | 0% | -37% |
| Qantas | 6.05 | 1.42 | -77% | 3.02 | 113% | 2.9 | -4% | -52% |
| Ryanair | 6.33 | 1.97 | -69% | 4.11 | 109% | 4.11 | 0% | -35% |
| SIA | 20.1 | 9.38 | -53% | 16.5 | 76% | 16.18 | -2% | -20% |
| Southwest | 18.15 | 4.99 | -73% | 13.95 | 180% | 13.04 | -7% | -28% |
| United | 51.49 | 3.13 | -94% | 26.44 | 745% | 26.44 | 0% | -49% |
| Vueling | 46.7 | 3.08 | -93% | 14 | 355% | 9.32 | -33% | -80% |
| FTSE | 6732.4 | 3512.1 | -48% | 5825 | 66% | 5661.6 | -3% | -16% |
| LAST CYCLE | RECOVERY | - CURRENT | ||||||||||||||
| CYCLE | ||||||||||||||||
| Peak (2007) | Trough (late’08/early ‘09) | P-T | Recent Peak | T-P | Current (8/10/10) | P-C | Current/Last Cycle Peak | |||||||||
| Air Berlin | 20.42 | 2.63 | -87% | 4.49 | 71% | 3.1 | -31% | -85% | ||||||||
| Air France/KLM | 38.3 | 6.36 | -83% | 12.88 | 103% | 11.84 | -8% | -69% | ||||||||
| AirAsia | 2.11 | 0.79 | -63% | 2.25 | 185% | 2.17 | -4% | 3% | ||||||||
| American | 40.66 | 2.54 | -94% | 10.16 | 300% | 6.35 | -38% | -84% | ||||||||
| British Airways | 577.5 | 109.9 | -81% | 266.1 | 142% | 264.2 | -1% | -54% | ||||||||
| Cathay | 21.73 | 6.82 | -69% | 22.1 | 224% | 22.1 | 0% | 2% | ||||||||
| Delta | 22.79 | 3.93 | -83% | 14.93 | 280% | 11.4 | -24% | -50% | ||||||||
| easyJet | 732 | 220.25 | -70% | 496.5 | 125% | 451.6 | -9% | -38% | ||||||||
| GOL | 38.3 | 2.79 | -93% | 17.23 | 518% | 17.23 | 0% | -55% | ||||||||
| Iberia | 4.11 | 1.25 | -70% | 3.06 | 145% | 3.04 | -1% | -26% | ||||||||
| Lufthansa | 22.62 | 7.3 | -68% | 14.33 | 96% | 14.33 | 0% | -37% | ||||||||
| Qantas | 6.05 | 1.42 | -77% | 3.02 | 113% | 2.9 | -4% | -52% | ||||||||
| Ryanair | 6.33 | 1.97 | -69% | 4.11 | 109% | 4.11 | 0% | -35% | ||||||||
| SIA | 20.1 | 9.38 | -53% | 16.5 | 76% | 16.18 | -2% | -20% | ||||||||
| Southwest | 18.15 | 4.99 | -73% | 13.95 | 180% | 13.04 | -7% | -28% | ||||||||
| United | 51.49 | 3.13 | -94% | 26.44 | 745% | 26.44 | 0% | -49% | ||||||||
| Vueling | 46.7 | 3.08 | -93% | 14 | 355% | 9.32 | -33% | -80% | ||||||||
| FTSE | 6732.4 | 3512.1 | -48% | 5825 | 66% | 5661.6 | -3% | -16% | ||||||||
| Hang Seng | 31638.22 | 11015.84 | -65% | 23207.31 | 111% | 23121.7 | 0% | -27% | ||||||||
| S&P 500 | 1565.15 | 676.53 | -57% | 1217.28 | 80% | 1169.77 | -4% | -25% | ||||||||
| Financial Year | Passengers | |||
| (to March 31) | Fleet | (m) | ||
| 2010 | 232 | 66.5 | ||
| 2011 | 272 | 73.5 | ||
| 2012 | 294 | 80.0 | ||
| 2013 | 299 | 85.0 | ||