Market balance: Outlook ambiguous
October 2002


While the stock market performance of the major airlines is one of unalleviated gloom, the global supply/demand picture is, if not more optimistic, then more ambiguous.
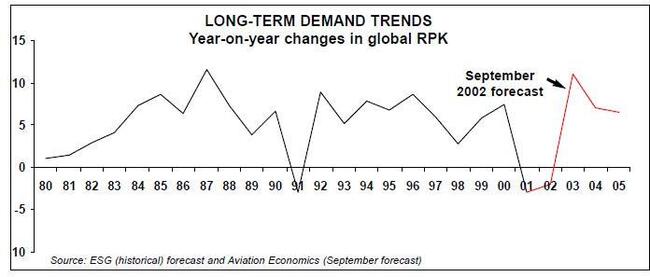
Our updated traffic projections are shown opposite — another negative result this year followed by a distinct upturn in 2003.
Compared with the October 2001 forecast, published just a few weeks after the September 11 atrocity, the outlook is somewhat brighter. The downturn wasn’t quite as steep as predicted, -3% in 2001 and -2% in 2002 as against the original -6% and -5%; the 2003 rebound won’t be quite as dramatic, though at 11% our prediction is higher than the norm. (We are not in this forecast factoring in the impact of war in Iraq — that would be too painful.)
Unlike some other analysts, we are sticking to the idea that most of the traffic lost following September 11 will be recovered over the next few years. In other words, the forecast assumes that traffic will return to close to the levels — up to 100% for non–US carriers and around 90% for US airlines — that they should have been at had September 11 not happened. The established longer–term relationship between air travel and levels of economic activity will be restored by a marked traffic upturn, as they were, for example, after the Gulf war. But, as in the past, the projected recovery will largely be generated by lower yields.
An immediate test will come with the traffic figures for the final quarter of this year.
For example, US international RPKs could show an increase of up to 30%, a startling contrast to the -12% growth figures for the first eight months of 2002. This figure is generated by comparing recent traffic levels against 2000, assuming the trend will continue, then simply calculating the increase against the very depressed period of 2001.
Other sectors will also rebound though less dramatically.
This could have an important psychological impact on the industry. It may even encourage reluctant travellers to get on planes again.
It is also worth considering what is happening in the "real" economy. Bombarded by horror stories about plummeting stock–prices, dotcom follies and corporate malpractice, one might think that the industrial economies were in meltdown. Yet the official GDP growth rates and predictions tell a different story. According the OECD, probably the most influential global forecaster, the real GDP cycle bottomed out in 2001, growth resumed in 2002 and 2003 looks rather good, very good for world trade, and by implication quite promising for traffic demand.
Here are some comments from the latest OECD Economic Outlook (July 2002):
"Growth momentum is returning to the OECD area at large … The correction in the inventory overhang appears to be well advanced … The collapse of investment in information technologies is generally giving way to a cautious recovery … Confidence has returned more rapidly than previously expected in the wake of the 11 September terrorist attacks, especially in the United States … A strong impulse has been provided by economic policies, with low real interest rates helping to boost consumer spending and fiscal policy supportive of demand".
An alternative, and plausible, airline industry view is that there has been a permanent loss of traffic and that a deep airline rationalisation process will lead to a new lower rate of growth than the traditional global average of around 5%. If the US industry consolidates through the Chapter 7 bankruptcy of, say, two majors and the European industry rationalises through the smaller flag–carriers retreating into regional niches, this might result in a new restrained form of competition, focusing on yield maintenance rather than market share.
On the other hand, aggressive carriers will always try their utmost to take advantage of the new opportunities provided by industry restructuring.
Expansion is the last thing on the traditional carriers' minds at the moment, but when the upturn does come there will be a ready supply of relatively cheap equipment available from the manufacturers and the lessors. It is also becoming apparent that there are limits to downsizing — see page 1 for an example.
Turning to the supply side, Boeing has so far taken most of the pain: units delivered have fallen from an historic peak of over 500in 2001 to about 350 this year and are forecast to drop below 300 in 2003. Airbus has managed to maintain output; units delivered totalled 325 in 2001 and have fallen to about 300 this year with a similar number anticipated for 2003. Regional jet deliveries from Embraer and Bombardier actually peak this year and next at around 330 a year.
Retirement scrapping — aircraft permanently removed from the commercial fleet — was recorded by ESG at 308 in 2001, which was a record. Annual averages of 350 units are expected for the next few years. But interpreting deletions is complicated — see below.
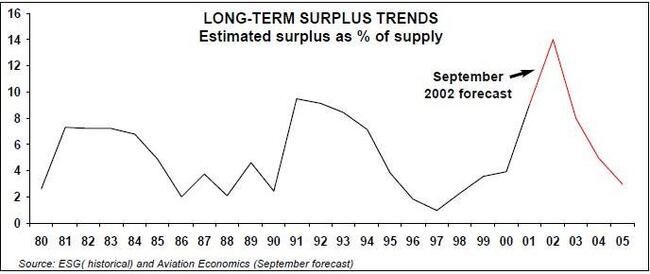
The graph (on page 5) shows the surplus, which is simply the difference between supply and demand. Supply is the actual or projected number of passenger and cargo jets in commercial service or parked. Demand is calculated in terms of jets by converting actual or projected RPKs into units required using "balanced market" productivity factors (load factors and utilisation) and "network" factors (average speed and average seats per aircraft).
The estimated surplus for 2002 is just under 2,200 or about 14% of supply, compared to the previous record surplus of 9% in the early 90s.
This theoretical total ties in very nicely with the 2,219 jets that are currently parked, according to ACAS. However, as the table below indicates, many, perhaps half these jets are unlikely to return to commercial service (the Chapter 2 types and the Chapter 3s that are over 25 years old add up to about 1,100).
This implies that we can be more than confident about the 350 future deletion rate, as these aircraft are already condemned.
So the combination of this supply adjustment plus the demand rebound results in a surprisingly steep decline in the surplus after 2003. In other words, the airline industry could turn round rather quickly. This is not the consensus expectation.
| 2001 | 2002 | 2003 | |
| US | 1.2 | 2.5 | 3.5 |
| EU | 1.7 | 1.5 | 2.8 |
| Japan | -0.4 | -0.7 | 0.3 |
| World | 1.0 | 1.8 | 3.0 |
| World trade | 0 | 2.5 | 9.5 |
| US | US | US | Euro | Euro | Euro | Asian | Asian | Asian | World | World | World | |
| Dom | Int'l | Total | Intra | Int'l | Total | Intra | Int'l | Total | Intra | Int'l | Total | |
| 2000 | 6% | 7% | 6% | 2% | 7% | 7% | 9% | 11% | 11% | 5% | 9% | 7% |
| 2001 | -7% | -6% | -7% | 1% | -1% | -1% | 1% | 0% | 0% | -4% | -2% | -3% |
| 2002 | -2% | -3% | -2% | 1% | -3% | -2% | 2% | 0% | 1% | -1% | -2% | -2% |
| 2003 | 9% | 12% | 10% | 5% | 9% | 8% | 12% | 12% | 10% | 9% | 12% | 11% |
| 2004 | 5% | 6% | 5% | 5% | 6% | 6% | 8% | 9% | 9% | 6% | 7% | 7% |
| 2005 | 5% | 6% | 5% | 5% | 6% | 6% | 8% | 9% | 9% | 6% | 7% | 7% |
| CHAPTER 3 COMPLIANT | CHAPTER 2 ONLY | |||||||||||||
| 5-9 | 10-14 | 15-19 | 20-24 | 25-29 | 30-34 | Sub | 15-24 | 25-34 | Sub | |||||
| <5 | years | years | years | years | years | years | 35 years+ | Total | years | years | 35 years + Total | TOTAL | ||
| 717-200 | 24 | 24 | 24 | |||||||||||
| 727 | 4 | 153 | 80 | 32 | 37 | 306 | 25 | 87 | 25 | 137 | 443 | |||
| 737-2/300 | 1 | 3 | 20 | 70 | 70 | 8 | 9 | 181 | 31 | 66 | 97 | 278 | ||
| 737-4/500 | 4 | 13 | 17 | 17 | ||||||||||
| 737-7/800 | 27 | 27 | 27 | |||||||||||
| 757 | 3 | 5 | 16 | 16 | 1 | 41 | 41 | |||||||
| A320 family | 27 | 32 | 15 | 74 | 7 | 42 | 22 | 71 | 145 | |||||
| DC-9 | 20 | 29 | 53 | 14 | 116 | 116 | ||||||||
| MD80/90 | 6 | 9 | 25 | 36 | 34 | 110 | 110 | |||||||
| 747-2/300 | 1 | 15 | 55 | 16 | 21 | 108 | 7 | 40 | 47 | 155 | ||||
| 747-400 | 3 | 13 | 9 | 4 | 29 | 29 | ||||||||
| 767 | 6 | 14 | 25 | 45 | 45 | |||||||||
| 777 | 2 | 2 | 4 | 4 | ||||||||||
| A300/310 | 3 | 3 | 29 | 32 | 40 | 5 | 112 | 112 | ||||||
| A330/340 | 10 | 10 | 20 | 20 | ||||||||||
| DC-10 | 1 | 33 | 40 | 5 | 79 | 3 | 4 | 7 | 86 | |||||
| DC-8 | 65 | 7 | 72 | 4 | 10 | 14 | 86 | |||||||
| L1011 | 1 | 46 | 37 | 2 | 86 | 86 | ||||||||
| MD11 | 1 | 11 | 4 | 16 | 16 | |||||||||
| BAe 146/F100 | 7 | 14 | 69 | 11 | 101 | 101 | ||||||||
| RJs | 33 | 5 | 1 | 39 | 39 | |||||||||
| Others | 49 | 132 | 58 | 239 | 239 | |||||||||
| TOTAL | 147 | 104 | 221 | 210 | 461 | 219 | 187 | 58 | 1607 | 122 | 375 | 115 | 612 | 2219 |
| Source: ACAS | ||||||||||||||