Airline share prices: How low can they go?
October 2002

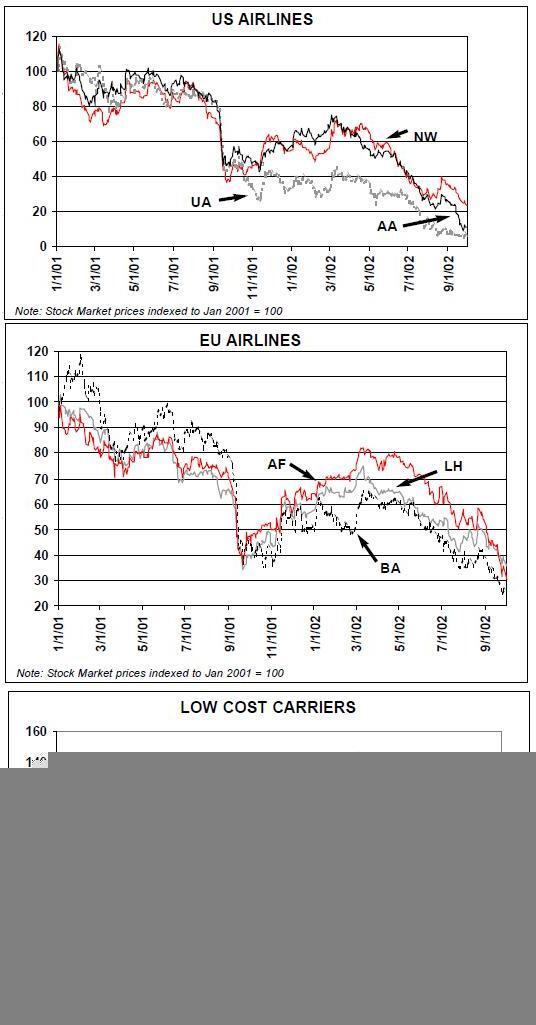
British Airways shares fall out of the FTSE 100 index and the share price dips below its flotation price in 1987. American Airlines' parent AMR Corp sees its shares hit $4 — a decimation of the price two years ago. Lufthansa and Air France languish at less than half the valuation of a year ago and KLM lies well below half the $1bn market capitalisation that would mark respectability.
In the last week of September the major carriers' share prices have fallen by between 15% (Lufthansa) and 55% (American).
By contrast, the low cost carriers have been less affected by the sell–off in the sector. Ryanair’s share price in particular has been resilient,currently trading at the same level at the beginning of 2001 and only 20% below its peak. easyJet meanwhile is nearly 50% below its peak — in part reflecting thoughts that it may be suffering some indigestion from the acquisition of Go. Still, easyJet’s market cap is now within a gnat’s hair’s width of that of British Airways.
We know the reasons for lack of positive sentiment towards traditional airline shares. Weakness in demand started to be felt in the first half of 2001. The operational instability was then severely, suddenly and shockingly disrupted further by September 11. The slow recovery from that shock has been further hit by the now pervasive threat of a US declaration of war against Iraq.
If that wasn’t enough, the world’s stock markets have had confidence completely undermined by the weak global economic environment, the accounting scandals in the US and the collapse of the dotcom and telecoms bubble.
Where’s the floor?
Over time the world’s major airlines have performed consistently on the stock markets: they have tended to destroy value for their shareholders. However, through the cycles individual investors have been able to make substantial returns by investing and divesting at the right time. There are two general rules of thumb that have emerged:
- Buy when the share price is below two times prospective cash flow and sell above three times cash flow; and
- In the downturn expect the share price to halve; in the upturn look for a doubling.
However, to paraphrase the financial regulators, "the past is not necessarily an accurate guide to the future". This time it may well be different. Some fundamentals: the theoretical value of a share can be viewed as the sum of future cash flows of the company’s operations discounted to the current day by a risk factor. That risk factor is made up of the risk free rate (such as the interest rate on long–dated government bonds) plus the risk premium present in the market at any one time inflated by the perceived extra risk inherent in the stock being valued.
The world’s stock markets are in a bear phase. New York’s Dow has fallen 26% since the beginning of the year and London’s FTSE nearly 30%. The rot really set in in June, since when the markets have displayed remarkable levels of volatility and limited volumes. In a bear market, investors retreat to safe havens, switch money out of high risk investments and run away scared from any that provide disappointing shocks.
Broadly speaking institutional investors split market investments into three broad categories: big cap, mid cap and small cap relating to the overall market capitalisation of the stock. In all cases, investors are looking to make money. The higher the market capitalisation, generally the higher the volume in transactions and the higher the marketability of the shares. For the big cap stocks the view will be for out–performance against peers, industry group or market indices. For mid cap stocks, the investor must be convinced of sustainable returns. For small cap stocks the growth potential must outweigh the increased perceived risk.
For the big cap stocks — and particularly those included in a stock market index — there is an additional element of demand in that some institutional investors attempt to track the index and have to maintain weightings in each of the constituent stocks.
Airline share prices are notoriously cyclical, volatile and high risk despite the fact that in each cycle there is at least one airline CEO or CFO who tries to say that it is not.
(The famed investor Warren Buffet was recently quoted as saying that he kept a 1–800 number for Aeroholics Anonymous close at hand that he could call whenever he felt the urge to invest in an airline, so that someone could dissuade him from doing so). Apart from anything else, so much of an airline’s operations lie outside management control: and a small change in fuel prices, exchange rates, demand or yields can have a dramatic impact on the bottom line profitability.
War!
The real problem at the moment is the threat of war. This is seen to have two main impacts: potential disruption to traffic and substantial increases in fuel prices. Markets dislike uncertainty — and while there is the prospect of the US going into Iraq with or without the backing of the UN they will keep clear of aviation. If war were to be declared the markets will start reviewing the ideas of how long it may last and how quickly the industry may recover and consequently start looking at fundamental valuations.
All in all the environment is not good. The markets dislike uncertainties and here we have uncertainties piled on top of worries mounted by fears. There may be a gut reaction that says a share price cannot go much lower.
Equally it is worth remembering that share prices can go to zero.
| Share price | Price/ | ||||||
| 1/10/02 (local currency) | Earnings ratio | Price/Cashflow | EV/EBITDAR | ||||
| Air France | € 7.78 | 6.7 | 1.3 | 3.9 | |||
| British Airways | 96.75p | 3.1 | 1 | 4.2 | |||
| KLM | € 8.36 | 5.8 | 0.7 | 4.7 | |||
| Lufthansa | € 9.45 | 5.7 | 1.9 | 3 | |||
| SAS | SEK52.5 | 6.9 | 2.1 | 4.5 | |||
| Source: WestLBPanmure | |||||||