United: what's the optimal growth rate?
November 1999


According to United’s top management, zero growth let alone downsizing is simply not an option. The largest US Major remains convinced that capacity growth, albeit at fairly modest levels, is essential for profitability even in a relatively mature market. During the period 1994–98 United’s domestic capacity grew by an average of 3.2% pa compared the rest of the industry at 2.5%. Its unit revenues (revenue per ASM or RASM) increased at 2.7% pa compared to 2.2% for the rest of the industry. The higher than average growth rate and the higher than average profitability improvement are connected for various reasons.
First, growth deters competitive incursion. Remaining static attracts the attention of competitors, particularly low–cost new carriers. If they succeed, new entrants are likely to steal market share from the incumbents and then capture the large majority of incremental growth in what will be a stimulated market (for instance, the United Shuttle, when it was introduced in to the Californian market in the mid–90s, was quickly able to take the market away from the incumbent, Delta). If they fail, they will still probably have undermined the yield structure.
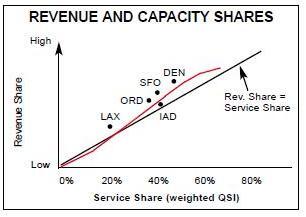
Second, increased city presence enables United to achieve a disproportionately high share of revenue compared to its capacity share. The graph (right) shows the relationship between revenue and capacity shares at United’s hubs; the curve describes the classic S–curve shape. As an airline becomes larger in a city it is likely to capture more business traffic because of increased frequencies in key markets and a wider range of destinations. In turn, it is able to negotiate more corporate volume agreements, offer a more attractive FFP — in short, become the "natural choice".
In reverse, United’s experience of keeping capacity constant in markets where other airlines have been growing at 3% p.a. has been a fall in RASM over a five year period of about 1.8%.
Third, connecting revenue growth is correlated, hardly surprisingly, with capacity growth at a city. United noted that at Chicago its domestic growth during 1993–98 was non–existent and domestic connecting revenue grew at about 3% p.a. while at Los Angeles and Denver capacity growth of 6- 7% p.a. brought connecting revenue growth of 9–11% p.a.
Fourth, United claims that business travellers prefer bigger airlines — or more precisely the bigger airlines tend to get the corporate travel contracts. For example, United, Delta and American with about 51% of industry capacity hold about 85% of the primary corporate travel accounts (defined as the “Top Corporate Travel 100”) while the remaining 15% are shared among the other Majors.
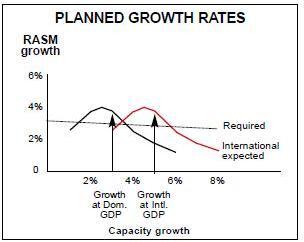
Fifth, for United the rate of capacity growth has partly been driven by the requirement to develop its newer hubs. At Denver and Los Angeles it has been increasing capacity at 6–7% p.a. in what it describes as a high growth, high potential markets. This chart (below) summarises United’s strategy. It shows the "required" combinations of RASM growth and capacity growth for United to achieve its target of a 11.2% increase in earnings (that produced by the top quartile of general US industry).
Superimposed on this line are the expected curves for domestic and international RASM/capacity growth under given assumptions about GDP growth.
In summary then, United’s annual capacity growth targets are 1.5–2.5% domestically, 4–5% internationally and 2.4–3.4% for the whole system.
United’s strategy would appear to be a rational middle way between the frantic market share battles of the late 80s in the US and BA’s experimentation with downsizing today. However, all of the US big three more share one fundamental worry about growth strategies: if they maintain their recent growth rates, and Southwest continues its (profitable) expansion, then the largest US Major in 2010 will be… Southwest.