FedEx:
Shipping the Goods
May 2019

In the late 90s FedEx briefly branded itself as the “Official Airline of the Internet”. It seemed plausible — transactions would be increasingly be conducted online. Amazon, the then new electronic bookstore, might carve out a small niche for itself in the publishing market. Google was just a search-engine. FedEx was perfectly positioned to provide rapid physical transport for goods ordered through websites.
It hasn’t quite worked out like that. FedEx is still the world’s largest air express operator, with a current fleet of 396 jets and 284 turboprops, but its traffic volumes have been stagnant or in decline for some time — even accounting for its 2016 acquisition of European TNT Express. Its relationship with the internet and e-commerce has been complicated.
FedEx reported an adjusted operating profit of $4.9bn on revenues of $65.5bn in its last financial year (to May 2018), a respectable overall 8.7% margin. In the nine months to end February 2019 it increased revenues by 8% to $51.9bn and adjusted operating profits by 7% to $3.50bn up from $3.29bn in the prior year period — giving a 1.7 point increase in margins for the period.
The Groups has a strategic aim to generate an operating margin of 10%, increase earnings per share by 10%-15% a year, improve cashflows, increase RoiC and increase returns to shareholders.
But FedEx’s strategy is not based on rapid traffic growth but on cutting costs, rationalisation and yield increases.
At the operating level FedEx breaks down its performance by segment. It is perhaps surprising to note how modest the profitability of the air operation, FedEx Express, is compared to that of the boring Ground segment. Even the traditional Freight segment produces a higher margin. In the first three quarters of FY 2019 (to end May) FedEx’s margin improved to 6.8%, with Express at 4.9%, Ground 12.0% and Freight 7.5%.
However, FedEx Express operating profits have been under pressure from the effects of integrating TNT Express which FedEx acquired in 2016 for €4.4bn — its largest acquisition to date in its 45 year history. Also the 2018 results were effected by the NotPotya cyberattack on TNT — apparently part of a nation-state supported ransomeware attack on Ukraine. The group estimated it cost them $400m in disruption and lost business.
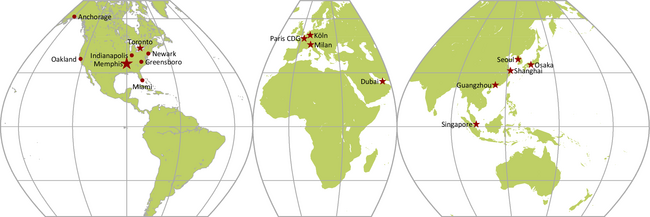
The integration of TNT within the FedEx Express segment is a complex and costly affair: it spans over 200 countries and territories worldwide, and involves combining pickup-and-delivery services at the local level. Integration expenses amounted to some $380m in 2018 up from $175m in the year before and is expected to come in at around $435m for the year to end May 2019.
The TNT acquisition increased the exposure to Europe which now accounts for a “significant percentage” of the combined FedEx/TNT international revenue, workforce and facilities. In February it was proud to announce that it started to integrate the FedEx intra-European shipments into the TNT Express European road network which would provide European customers with at least one business day of transit time improvement on 40% of traffic lanes.
Given the complexities of different employment regulations in individual countries — requiring, for example, employee and works' council consultations — the group suggests that although the majority of the integration programme will be substantially complete by the end of FY 2020, further work will continue into the following year and that the whole programme will have cost around $1.5bn.
But the group expects the combination with TNT Express to generate significant synergies and is targeting an operating profit for the segment in the year to May 2020 some $1.2bn-$1.5bn higher than the $2.1bn achieved in 2017.
That expectation is based on “moderate economic growth and stability in global trade”.
Fleet renewal
The company is part way through a major fleet renewal programme. It is in the process of retiring its 40-year old DC10 fleet and has outstanding orders to acquire 50 new build 767-300Fs and 15 777Fs (see table) which are expected to provide respectively a 30% improvement in trip cost and 18% improvement in fuel efficiency compared with the MD11. The current fleet plan envisages the jet fleet to grow by 37 units by the end of May 2024 — a modest seven units a year with most of the deliveries designed for replacement of older aircraft — but the company retains significant flexibility given the timing of lease expirations scheduled on the MD11 and A300 fleets. To serve smaller markets more effectively FedEx has ordered 30 new ATR 72-600F with customised large cargo doors and 50 newly designed Cessna SkyCourier C-408 twin turboprops which have nearly twice the volume of the company’s current single-engine Cessnas.
Competing forces
E-commerce has developed in ways that have not necessarily benefited FedEx and the other integrators. Most obviously the volume of documents and contracts that formerly was air-expressed has greatly diminished with email. Just-in-Time inventory control is not as dominant as previously, partly because hardware has become much more reliable and much less expensive, reducing the cost of inventory held by retailers. Software is now universally downloaded over the internet rather than dispatched as discs in a polystyrene-filled package.
A worrying development for the integrators is a change in distribution strategy by the big e-commerce retailers in order to reduce their own shipping costs. Fulfilment costs, which are mostly transport-related, have risen to 15.5% of Amazon’s revenues, up from 11% in 2009. Amazon has been decentralising its warehouse network away from its Seattle base, building new facilities in, initially, San Francisco, New York, Boston and Chicago and ultimately targeting the top 50 urban markets. The additional cost of the new facilities will, Amazon expects, be outweighed by savings generated by cutting FedEx and UPS out of the distribution chain and using its own, franchised local delivery companies under the Amazon brand.
It also started up its own freight airline Amazon Air, with a main hub based in Hebron, Kentucky at Cincinnati/North Kentucky Intl airport. Starting with 20 767Fs in 2016 it currently operates 33 and has plans to increase the fleet to 50 aircraft by 2020.
The ultimate aim for Amazon is to guarantee one day, or even one hour, delivery to customers — as close to physical shopping as possible. Google is moving inexorably into this market with a slightly different concept — here the customer orders online and a local courier company, branded Google Express, picks up the good from the shop and delivers it to the customer’s home.
The e-commerce giants are not, however, guaranteed success. FedEx and UPS aver that logistics is a complicated business in which they have decades of experience. Their customers are not going to leave them for the new e-commerce upstarts. The bricks-and-mortar retailers are not going to give without a fight either. FedEx has strategic links with Walgreens and Walmart with convenient pickup and drop off locations. FedEx is placing 500 new FedEx office locations in Walmart stores nationwide. Walmart too announced this year that it plans to offer next day guaranteed delivery direct from its warehouses — no doubt using both FedEx and UPS.
Then, there is a further technological break-through on the near horizon — commercial drones delivering air cargo (after all, wars are now been fought using drones). Amazon’s Prime Air, using an octopus-looking unmanned aircraft, is according to Amazon, ready for service from a technological point of view. It will have a payload of 5lbs and a range of 10 miles. It was successfully tested in Cambridge (England), and only requires FAA approval. In the UK BALPA, the pilots union, has been lobbying for strict regulation of drones on safety grounds (the need for which has been highlighted by the two day closure of London Gatwick in December because of a rogue drone operator), but it expects drones “the same size as small passenger aircraft” to be operating commercially within ten years.
| FY end May | To Be Delivered/(Retired) in FY | |||||||||||
|---|---|---|---|---|---|---|---|---|---|---|---|---|
| Type | Gross payload ('000lbs) | 2016 | 2017 | 2018 | 2019 | 2020 | 2021 | 2022 | 2023 | 2024 | 2024 Fleet | |
| Trunk Jet Aircraft | 757 | 63.0 | 119 | 119 | 119 | 119 | 119 | |||||
| 767F | 127.1 | 32 | 46 | 57 | 73 | 17 | 18 | 12 | 6 | 126 | ||
| DC10-10 | 137.5 | 30 | 26 | 25 | 18 | (11) | (7) | |||||
| DC10-30 | 175.9 | 13 | 13 | 13 | 13 | (7) | (6) | |||||
| MD11 | 192.6 | 56 | 57 | 57 | 57 | [2]† | [1]† | [2]† | [3]† | 57 | ||
| 777F | 233.3 | 27 | 30 | 34 | 38 | 5 | 2 | 3 | 4 | 1 | 53 | |
| 747-400 | 261.4 | 2 | 2 | 2 | ||||||||
| A300-600 | 106.6 | 68 | 68 | 68 | 68 | [7]† | [10]† | [1]† | [2]† | [7]† | 68 | |
| A310-300 | 83.2 | 10 | 10 | 10 | 10 | 10 | ||||||
| Subtotal | 357 | 371 | 385 | 396 | 11 | 6 | 9 | 10 | 1 | 433 | ||
| Feeder Aircraft | Cessna 208B | 2.8 | 239 | 239 | 239 | 238 | 238 | |||||
| Cessna 4083 | 6.0 | 12 | 12 | 12 | 14 | 50 | ||||||
| ATR-72 | 18.0 | 21 | 21 | 21 | 21 | 21 | ||||||
| ATR-72 600F4 | 17.6 | 5 | 6 | 6 | 6 | 23 | ||||||
| ATR-42 | 12.1 | 26 | 26 | 25 | 25 | 25 | ||||||
| Subtotal | 286 | 286 | 285 | 284 | 17 | 18 | 18 | 20 | 357 | |||
| Fleet Total | 643 | 657 | 670 | 680 | 11 | 23 | 27 | 28 | 21 | 790 | ||
Note: † Scheduled lease expiry, fate of aircraft to be determined at end of lease and not included in totals
| Year end 31 May | FY 2018 | Q1-Q3 FY 2019 | ||
|---|---|---|---|---|
| $bn | %ch | $bn | %ch | |
| Revenues | ||||
| FedEx Express | 36.2 | 7% | 27.8 | 5% |
| FedEx Ground | 18.4 | 11% | 15.2 | 12% |
| FedEx Freight | 6.8 | 12% | 5.6 | 14% |
| FedEx Services | 1.7 | 2% | 1.2 | 3% |
| Other | 2.4 | 5% | 2.0 | 10% |
| Total | 65.5 | 9% | 51.9 | 8% |
| Operating profit | ||||
| FedEx Express | 2.1 | -12% | 1.4 | 10% |
| FedEx Ground | 2.5 | 13% | 1.8 | 7% |
| FedEx Freight | 0.5 | 32% | 0.4 | 31% |
| Other* | -0.9 | 99% | -0.5 | 38% |
| Total | 4.3 | -6% | 3.2 | 7% |
| Operating margin | ||||
| FedEx Express | 5.8% | -1.2pt | 4.9% | +0.2pt |
| FedEx Ground | 13.7% | +0.2pt | 12.0% | -0.6pt |
| FedEx Freight | 7.2% | +1.1pt | 7.5% | +1.0pt |
| Group adj | 8.7% | -0.3pt | 6.8% | +1.7pt |
Source: Company reports. Note: *Corporate, other and eliminations
Source: Company reports. Note FY end May 31