The revenue recovery
May 2011

One of the main elements of the industry recession and recovery over the past two years has been the remarkable revenue and yield performance. In the recessionary year of 2009 total industry revenues fell by an estimated 14%, with passenger demand down by just over 2% and yields down by an unprecedented estimated 14%. The 2010 recovery has seen a significant bounce back with traffic volumes overall expected to have grown by over 7%, yields up by a possible 6% and total industry revenues up by 14% — not still not quite back to the peak year of 2008.
Admittedly in this period the revenue performance has been a little confused by the volatility in fuel costs — the average price per gallon of jet fuel paid by the US industry rose by 18% to $2.24/gal in 2010 after a 38% decline in 2009, and total fuel costs account once again for almost 30% of the US industry’s total costs (having reached an all time peak of 37% for the US industry in 2008) — although only an estimated 26% of total world industry costs, down from the 33% peak in 2008. On a global basis, excluding fuel from the revenue equation suggests that there may have been an underlying 4% yield weakness in 2009 but a near 10% strengthening in 2010 as demand (and premium demand especially) recovered.
Meanwhile in the last two years industry consolidation has accelerated. It is not just consolidation of capital in local or regional markets (such as the mergers between Delta and Northwest,United and Continental, BA and Iberia or LAN–TAM). In these cases the potential benefits of the combination of carriers should become clear through analysis of the published accounting statements (see briefing on United, page 6). The less tangible element of this consolidation phase is the development of inter–regional joint ventures; as pointed out in the March edition of Aviation Strategy, the Atlantic in particular is now dominated by the three effective virtual mergers in the form of “metal neutral” joint ventures of the main branded global alliances.
In these cases, the results, performance and benefits of the joint ventures are hidden from public view — as indeed are the terms of the joint ventures themselves, being shrouded in commercial secrecy; and the underlying benefits to each individual carrier perhaps only being analysable from anecdotal comments from senior management. For example, Air France being amazed, but without specifying, to find how much higher an operating margin KLM and Northwest had been achieving on the Atlantic through their joint venture; or Lufthansa management recently suggesting a “strong” improvement in joint Atlantic operations as a direct result of the introduction of the revenue sharing agreement with fellow Star members; or indeed United management stating at their Q1 results that they were “very comfortable with how the Joint Ventures are developing”.
Indeed the only element that may occasionally be required to be published is the balancing cash transfer between the respective partners — and United’s statement of a $100m transfer liability seemed to have confused some in the investment community suggesting an understandable lack of understanding of the workings of the metal neutral joint venture.
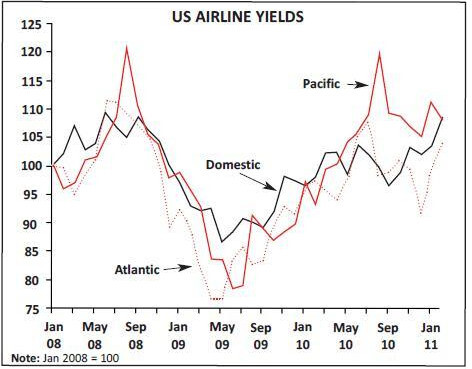
Any underlying benefits should surely turn up in the published unit revenues and yield performance. Whereas the industry as a whole is estimated to have achieved a 6% increase in underlying yields in 2010, the performance of the US industry has been far more positive. In the domestic markets — where the players last year showed extraordinary capacity constraint — average yields grew by 9%, but international yields jumped by 13% year on year — and within international routes the Atlantic was up by 18%, Latin America by 9% but the Pacific by over 20% — with the Pacific itself showing yields above the peak achieved in 2008.
The monthly performance has been even more dramatic — with a near 30–40% year on year growth in yields on the Atlantic and Pacific in selected summer months. At the same time the performance of Delta and United/Continental in particular seems to have been superior to the industry average — each showing a dramatic unit revenue increase on the Atlantic of over 20% in 2010 — compared with American’s more lacklustre 16% growth.
Numbers for the European partners may not be strictly comparable (apart from the exchange rate element, each has a slightly different definition of their route analysis from the DoT standard) but suggest at least for Lufthansa that a similar performance had been achieved. However, this strong performance throughout 2010 has not really been carried through on the Atlantic into 2011, possibly because of prior year comparisons and the weak nature of the first quarter.
It is however debatable whether yield benefits all derive from the joint ventures themselves. In the cases of Delta and United the strong unit revenue and yield performance on Atlantic and Domestic route networks could well be explained by other factors. Indeed the performance on the Pacific was far stronger in percentage terms; perhaps more to do with the bankruptcy at JAL and opening of Haneda than any joint venture agreement — and in fact the joint ventures on the Pacific between American and JAL, and United and ANA, only started in April this year following the signing of the US–Japan open skies agreement last October. It could indeed just be that as demand has recovered from the depths of the recession it has been strong enough for the major players to be able to recover the increases in fuel costs suffered through the last year as well as some of the ground lost from the cyclical utter loss of demand in 2009. Interestingly, on the publication of the Q1 results there seemed to be an agreement that the higher fuel surcharges are not (at least yet) having any dampening impact on the underlying level of demand.
The US DoT’s insistence on the creation of binding “metal neutral” joint ventures as well as an open skies agreement as prerequisites of granting anti–trust immunity may be a pragmatic way of encouraging a de facto globalisation of airline brand, product and service while being hampered by the US’s own nationalistic adherence to the local capital ownership rules. Of course these immunised joint ventures can create problems: the partners are allowed to collude on capacity and pricing as part of their ATI and are in effect required not to compete with each other, but at the same time they can be prohibited from discussions with each partner’s partners not included in the joint venture with whom each is required to compete fully.
It is hardly surprising that Lufthansa has signalled a wish to create an immune joint venture partner with United’s new joint venture partner ANA; BA may not be far behind in wanting to link formally with AA’s joint venture partner JAL. Air France KLM is even looking to foster a joint venture agreement with a partner in China (while it and Delta already have an agreement with Korean) even without an open skies agreement in place.
| SYSTEM | ATLANTIC | ||||||||||
|---|---|---|---|---|---|---|---|---|---|---|---|
| Q1 2011 | FY 2010 | 1Q 2011 | FY 2010 | ||||||||
| Yield | Units revenues | Yield | Unit revenues | Yield | Units revenues | Yield | revenues | ||||
| IAG | 8.8% | 5.2% | 13.3% | 13.9% | n/a | 5.6% | n/a | n/a | |||
| American | 6.2% | 5.0% | 8.7% | 10.4% | 3.4% | -2.4% | 12.1% | 15.9% | |||
| Lufthansa | 5.1% | 1.5% | 8.4% | 10.2% | 7.3% | 3.1% | 17.9% | 18.4% | |||
| United | 12.7% | 9.9% | 15.2% | 17.9% | 8.5% | 1.3% | 19.4% | 22.6% | |||
| Air France/KLM | n/a | n/a | 13.1% | 15.1% | n/a | n/a | 18.7% | 20.5% | |||
| Delta | 12.0% | 7.0% | 13.0% | 12.0% | 8.0% | -1.0% | 18.0% | 21.0% | |||
Source: Company reports