Is China's booming airline industry set for a slowdown?
May 2008

China’s air transport industry has been growing steadily ever since 1987, when the fundamental restructuring of the country’s aviation infrastructure was launched. But while passenger numbers have boomed in the 2000s, China’s current economic cycle is now approaching its peak. Although 2008 is a so–called "Golden Year" for China’s airlines, do they need to prepare for tougher times ahead?
The market forecasts issued by Airbus and Boeing continue to paint a highly optimistic picture of China’s aviation industry, with expected annual average growth rates of between 6%-8% over the next 20 years.
Given the country’s huge population and relatively underdeveloped aviation market, these forecasts are entirely feasible over the long–term, as the fundamental drivers of China’s air transport — GDP and disposable income — will continue to grow over the next couple of decades.
Indeed, over the past seven years the Chinese airline fleet has grown by almost 600 aircraft, although the majority of this increase has come at China’s Big Three carriers (Air China, China Southern and China Eastern). Chinese start–up airlines have yet to play a significant role in the industry, and in the last seven years 12 new passenger airlines have added capacity of just 50 aircraft into the Chinese market.
And whereas in 2006 more than 200 domestic and 50 international routes were launched by Chinese airlines, passengers on these new routes accounted for just 4.5% of total passengers carried in that year.
Essentially, start–ups have as yet been unable to exert a significant impact on the Chinese aviation market, and the growth that is taking place comes mainly from increased passenger numbers on existing domestic and international routes.
Nevertheless, although growth in the 2000s has been concentrated around the Big Three, that growth has been substantial and sustained. In 1999, at the bottom of the last Chinese economic downturn, passenger load factor at Chinese airlines dropped to 58%, but over the past nine years load factor has climbed steadily, reaching 76% in the first three quarters of 2007. But it would be a mistake to assume that robustness of the Chinese aviation market will continue forever.
Economic slowdown
That’s because after almost five years of high growth, the combined factors of soaring inflation, increasing manufacturing costs, a tightening monetary policy and a gloomy global economy are signalling an end to China’s current economic upturn.
China’s outstanding economic growth over the last five years has been the result partly of the government’s fiscal and monetary policies, which were designed to pull the economy out of the recession caused by the east Asian financial crisis of the late 1990s and the global recession of the early 2000s.
These policies encouraged public and private sectors to borrow and invest in the Chinese economy at interest rates of less than 3%, which occurred at the same time as increased foreign investment into China in order to build and expand manufacturing capacity (and take advantage of China’s low labour costs).
But as China’s exports surged, higher foreign currency reserves in conjunction with an inflow of foreign capital have result–ed in excess liquidity in the country, pushing equity and property prices to a record high. Combined with rising oil and food prices, the Chinese government has now decided to encourage a soft economic landing rather than risk a full recession, and the most striking policy shift has been a tightened monetary policy, including higher interest rates and a reduced money supply.
Hence China has passed the peak of the current economic cycle, and an economic slowdown lies ahead, although the scale and duration is uncertain. Given that China’s GDP growth rate is expected to fall below 10% in 2008 and the rate of growth will continue to slow down over the next few years, what are the implications of this for China’s airlines?
Most obviously, the rate of growth in China’s passenger air transport market is likely to decelerate. While the first half of 2008 will see passenger demand and load factors continuing to climb, the post-Olympics years are likely to see a reduction in the rate of growth of these factors.
While the Chinese aviation industry will continue to expand, there’s little doubt that the rate of growth will slow down — but by how much is unknown at the moment, as this depends on whether a soft economic landing can be achieved and just how serious the global economic slowdown will turn out to be.
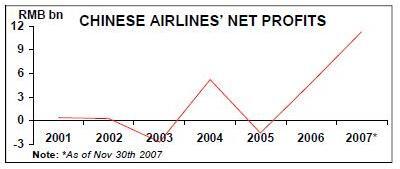
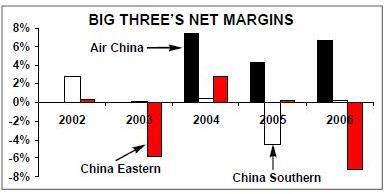
That uncertainly about air passenger demand in the future matters, because despite China’s aviation boom of the past few years, most Chinese airlines have seen their finances weaken over the same period. While airlines have increased net profit over the past seven years (see chart, page 17), these figures mask some worrying underlying facts.
Air China dominance
First, Air China accounts for more than 60% of total profits within the Chinese aviation industry. In 2004, when the airline industry reported its biggest profit — RMB 5.2bn (US$0.6bn) — for more than a decade, Air China contributed RMB 3.5bn of this. And in 2005 — when the industry overall recorded a financial loss — Air China posted a profit of RMB 2.6bn (US$0.3bn).
And in 2006 Air China’s profits of RMB 3.8bn (US$0.5bn) accounted for 80% of the industry’s total profits — although Air China’s phenomenal profits in 2006 are attributable mainly to gains from RMB appreciation, the sale of Dragonair and dividends from Cathay Pacific Airways (RMB 1bn, RMB1.6bn and RMB 0.5bn respectively).
Second, the surging net profits of the Chinese aviation industry have been gained largely from irregular items rather than from underlying operating profit. Among all the exceptional items, the most significant has been the gain from RMB appreciation, as China’s airlines finance aircraft deliveries largely through commercial debt or financial leasing denominated in US dollars. For example, as of June 30th 2007 China Southern had a US dollar debt from aircraft finance leases of around US$1.7bn.
Under the previous mechanism of RMB pegging against the US dollar, the airlines were unable to take advantage of the US dollar’s depreciation against other major currencies in the 2000s, and were there–fore unable to reduce their aircraft financing costs. However, after the RMB was freed from the pegging mechanism in July 2005 the currency appreciated steadily against the US dollar, and hence Chinese airlines' huge aircraft financing costs began to shrink.
In 2006, approximately 81% of seven publicly listed Chinese airlines' profits were derived from RMB appreciation, while in 2007 the RMB appreciated by 6.3%, resulting in China Southern, Air China and China Eastern boosting profits in the first half of the year by RMB 1.3bn, RMB 0.9bn and RMB 0.7bn respectively.
Sluggish productivity
In contrast, the performance of Chinese airlines' underlying operations has been less than spectacular. From 1998 to 2005, Chinese airlines' yield per RPK declined at an average annual rate of 1.6%, and even soaring passenger demand in 2006 and 2007 did not translate into yield improvement.
Air China, for example, reported a domestic passenger yield of RMB 0.6 per RPK in 2006 (the same as in 2004), while China Eastern posted a passenger yield of RMB 0.6 per RPK in 2006 — approximately the same as in 2000, when China’s economy was deflating.
Adjusted for inflation, yields have actually declined by about 10% over the period. And on international routes, where passenger traffic is still rising, Chinese airlines' average passenger yield is just 62% of the level of their international competitors to/from China.
On other measures too, the performance of Chinese airlines has been disappointing. The average utilisation of large and medium–size aircraft in Chinese fleets was 9.7 hours in the first half of 2007, just 0.1 hours higher than that in 2006. And in 2006, A320s and 737–700s — the types most widely used by Chinese airlines — recorded utilisation rates of 9.38 and 10.38 hours respectively, which is far from the widely–regarded "profitable" level of use (estimated at approximately 12 hours), especially considering the fact that the majority of these aircraft in the Chinese fleet are less than 10 years' old.
And while Chinese airlines' passenger load factor climbed to a high of 71.4% per cent in 2006, this was 4.6% lower than the average level for airlines globally. Chinese load factor is expected to increase to 74% in 2007, but this will still be lower than the global average.
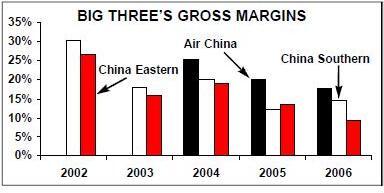
Without significant improvement in productivity, it is hardly surprising to see Chinese airlines' gross profit margins deteriorate, even in the market upturn (see chart, left). Soaring fuel prices might be blamed for the declining profits, but the woes of soaring fuel price have been cushioned by the appreciation of RMB over the last three years.
In 2007 the fuel price (which is set by China’s government) was actually slightly lower than that in 2005 and 2006, and China Eastern’s fuel costs, for example, accounted for 35% per cent of total operating costs in the first half of 2007, down from nearly 40% in 2005. Hence the argument that soaring fuel prices have swallowed Chinese airlines' profit is not convincing.
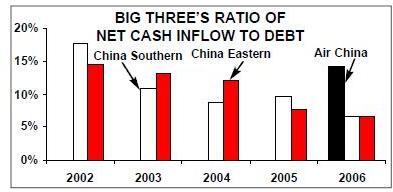
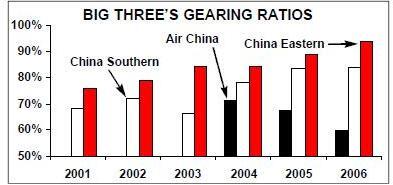
The more staggering statistic is Chinese airlines' net profit margin (see chart, below left) Although Air China has maintained a positive net margin, China Southern and China Eastern have been unable to make any significant net profits from the market upturn. Indeed, worryingly, the difference between the gross and net profit margins at China Southern and China Eastern is not explained by high fuel prices or any other external factors, but rather from those airlines' increased gearing (see chart, below).Higher debt levels have been attributed traditionally to the major consolidation among Chinese airlines in 2003 and 2004, in which China Southern and China Eastern merged with financially–troubled China Northern and China Northwest respectively.
However, the flaw in this argument is that both China Southern and China Eastern posted gearing ratios that were just 3% cent higher in the first year after they acquired the other major airlines — i.e. the debt attached to the acquired/merged airlines was a contributing rather than the principal reason for China Southern and China Eastern’s deepening financial difficulties.
In fact the driving force for these airlines' rising debt to equity ratios has been sharply increased capital expenditure, with — for example — China Eastern recording a capex of RMB 16.6bn (US$2.1bn) in 2006.
Accompanying the increasing leverage and capex has been a reduced cash inflow (see chart, above). Even in the market upturn most Chinese airlines could not improve their cash flows, and — for example — China Eastern reported a net cash inflow from operating activities of RMB 1.3bn in 2006, down from RMB 2bn in 2005. Only Air China has improved its net cash inflow recently.
Overall, the unprecedented boom over the recent four or five years has not significantly improved Chinese airlines' productivity, operational profitability or financial positions, and these airlines’ huge net profits in this period were an outcome largely of various external factors — the most important of which has been the steady and continuing appreciation of the RMB.
Big Three problems
Among the Big Three, the biggest challenges are increasing debt and weakening net cash inflows at both China Southern and China Eastern. Since these two airlines have been unable to stop debt from rising and net cash inflow from falling in times of prosperity, how will they be able to cope with the tougher times ahead? The most obvious solution is to find an equity investor, but China Eastern is currently struggling to overcome the various hurdles set by minority shareholder CNAC (owner of Air China) that are blocking China Eastern’s attempt to sell a 24% stake to Singapore Airlines and Temasek Holdings (the investment arm of the Singaporean government). If the deal does go ahead eventually, China Eastern could see its gearing reduced from 94% to around 80%.
However, no such solution is immediately available to China Southern, because under the current regulations it cannot sell any more shares to investors. Meanwhile Grand China Airlines — the parent of Hainan Airlines — is planning an IPO on the Hong Kong stock exchange, while Shenzhen Airlines (a medium–sized airline with 100 ARJ21s, 15 A320s and seven 737–800s on order) is expected to take the same approach.
Whether or not Chinese airlines obtain fresh capital in the next few years is crucial given the huge aircraft deliveries they are due to receive over the same period. In 2006 to 2010, the fleet growth rate set by CAAC is an average annual rate of 13% (compared with 10.4% in the previous five–year period). According to the CAAC’s plan, Chinese airlines will acquire 140, 160 and 140 aircraft in 2008, 2009 and 2010 respectively, the majority of which will be narrowbodies.
With less than 30 aircraft a year being withdrawn form the Chinese fleet in this period, by the end of 2010 China’s airlines are likely to be operating approximately1,400 aircraft, the majority of which will remain narrowbodies operating in the huge domestic market.
The huge increase in the fleet is likely to have two effects. Firstly, with air transport growth decelerating due to economic slowdown, Chinese airlines' load factors, aircraft utilisation and yields are likely to decline steadily. Consequently, airlines' profit margins and net cash inflow will deteriorate, and an aviation downturn similar to the one that occurred in 1998 and 1999 is likely to happen.
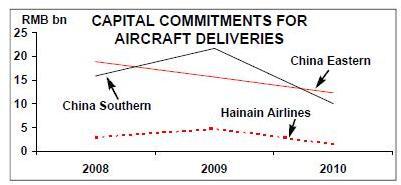
The second effect is that the airlines will have to somehow find the cash to finance these aircraft deliveries (see graph, right). But these new financial commitments will come on top of existing operating and finance lease rentals as well as a large amount of long–term commercial loans that will mature over the next few years. China Southern, for example, needs to pay a total of RMB 8bn (US$1.1bn) in 2009 for committed loans and rentals.
To make matters worse, the China Central Bank is continuing to raise interest rates, resulting in higher finance costs that will only further reduce the airlines' weak net cash inflow.
Among all large and medium–sized Chinese carriers, only Air China is an exception. Thanks to its strong cash flow position and its equity link with Cathay Pacific, the carrier is in a powerful position to acquire its financially weak peers in China, if opportunities present themselves.
Appreciation danger
The one factor that could help Chinese airlines pull through the next few difficult years is continuing appreciation of the RMB against the US dollar and most other currencies.
However, the RMB cannot continue to strengthen forever, and the currency’s exchange rate is expected to settle down to its "genuine" market level against other currencies within the next three to five years. And once it does that, this will halt the knock–on effect of appreciating RMB making imported aircraft cheaper and Chinese airlines being more profitable at the net level.
And then, of course, there is the effect of the oil price, which (if it continues to rise globally) may force the Chinese government at some point to raise the price of fuel in the Chinese market — a factor that many Chinese airline executives have never had to face before.
Overall therefore, while some analysts talk about 2008 being a "Golden Year" for Chinese airlines, economic slowdown and a number of other factors (such as large aircraft deliveries, weak balance sheets and the eventual stabilisation of the RMB) mean that the next two to four years are likely to be tough times for airlines in China — and perhaps so tough that the existence of some Chinese airlines may even be brought into doubt.