British Airways grows in strength - despite the LHR fiasco
May 2008

The recovery strategy that British Airways put in place in the late 1990s has finally come to fruition. At the time it found itself faced with severely falling margins — on short–haul from the incursion of the new LCC carriers and on long–haul from the typical cyclical build up of capacity, the introduction by competitors of the 777, its own expansion of high capacity equipment and the pursuit of growth for growth’s sake.
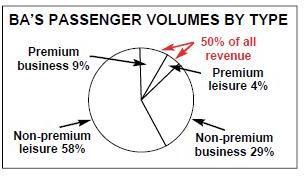
Promulgated by the then head of strategy, David Spurlock (who later went on to help found EOS), the plan involved concentrating on the traffic types and routes from which the company could earn money: premium point–to–point traffic and premium transfer traffic.
The company cut capacity, improved frequencies, de–hubbed Gatwick and embarked on an attempt to strengthen returns and the balance sheet in the knowledge that expansion at London Heathrow was severely constrained until the (belated) opening of the fifth terminal and the vague hope of further runway capacity at some point.
External blows
Of course in the process it encountered a few minor events outside its control (September 11, SARS, undermining of the UK pension system, introduction of IFRS etc), which each had further harmful effects on its financial position.
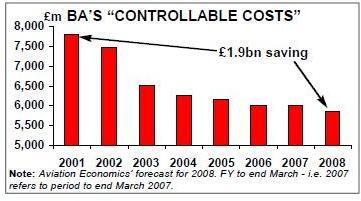
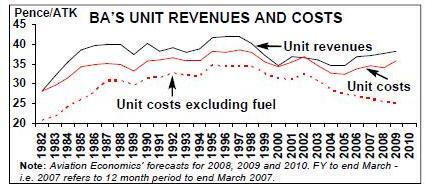
BA cut total capacity by nearly 20% — slightly less in ATK terms than ASK terms as it increased the size of premium cabins — and saw revenues fall by a similar amount. It took a series of sharp knives to its cost base — and among other things seriously attacked the managerial overheads arguably for the first real time since the merger of BOAC and BEA in the 1970s, removing some £1.9bn of controllable costs.
On the revenue and marketing side, it was the first European legacy carrier to have learnt something from the new airline models, and embraced the internet wholeheartedly as a distribution system. It introduced a far greater simplicity and flexibility of pricing tariffs in its capacity management system; went head–to–head with the LCCs on web–only pricing initiatives; and introduced competitive one–way fares while maintaining its perceived superior product quality.
Financial targets
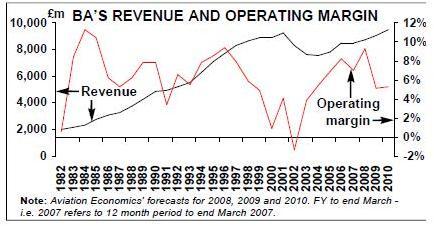
Over the years BA has used various corporate financial targets, not all of which have been all that understandable by all stakeholders. The latest — a target of 10% operating margin — had the benefit of being relatively simple. At the company’s Investor Day in March, it appeared to change this target to a range of 8–12% operating margin — although in fact all they did was to add certain other criteria that are used to create formulas that all boil down to the same result: throughout this time the company’s underlying financial strategy has been to bring the company’s operation to a point where it can consistently produce returns over the cycle in excess of cost of capital and therefore generate shareholder value.
Finally, for the year to end March 2008, it looks as if the company will have been able to achieve its magical 10% operating target.March 2008 also brought in a new era. It involved the inauguration of London Heathrow’s Terminal 5 (originally conceived to encompass all of BA’s and its alliance partners' operations at Heathrow) combined with the destruction of the machicolations over fortress Heathrow through the long–awaited EU–US open skies agreement.
T5 should really have opened several years ago — but was somewhat delayed by the ridiculous planning system in the UK (the planning enquiry was the longest ever) — and now will (eventually) encompass only the majority of BA’s operations; the remainder and those of its oneworld alliance partners will move to the (nearly) adjacent Terminal 3.
In the last few years, BA has had to distribute its services at its home hub over all the available terminals, substantially increasing complexity, adding to the difficulties of providing competitive minimum connecting times and reducing further the attractiveness of its product at Heathrow. At the same time the aging T4 services have become somewhat overloaded and, despite some upgrade work by BAA, those at T1 increasingly crowded.
The result has been a further degradation in product quality — exacerbated by the draconian security measures and increase in immigration controls that were imposed in an atmosphere of panic by the UK authorities after the attempted terrorist attacks in 2006.
One of the immediate impacts of limiting carry–on hand luggage was to increase the demands on the baggage systems at the airport by half, pushing an already worn and overloaded system at T4 over design constraints.
Not unsurprisingly, this led to some monumental and well–publicised failures, even further deteriorating BA’s perceived product quality. At the same time, the construction work on T5 limited ground access airside.
Since to get an aircraft to or from Terminal 4 (which is south of the southerly runway at Heathrow) requires crossing one of the runways, the resulting congestion undermined BA’s attempts to maintain a semblance of good on–time performance.
T5 benefits
The opening of T5 — which in itself is larger than many airports in their entirety — should alleviate many of BA’s product quality problems. First and foremost it is sited between the two runways, providing more efficient access for both take–off and landing, while the aircraft jetties and stands appear to have been designed with far fewer cul–de–sacs. It is now to encompass all of BA’s operations — apart from the 757 operations that will continue to operate out of T1 until the oneworld move to T3 — which will eventually significantly reduce interconnect times and substantially restore BA’s competitive position compared with Air France and KLM, Lufthansa and SWISS.
As part of the grand move at Heathrow, the SkyTeam alliance will operate out of Terminal 4, the Star Alliance out of Terminal 1 (to become with Terminal 2 the new Heathrow East) and all BA’s oneworld partners will move into Terminal 3. It is planned that once the second satellite for Terminal 5 is built (2011–2012?) BAA will extend the people–mover that connects the main body of the terminal to its satellites underground to Terminal 3, thereby allowing a reduction in minimum connecting times between it and its alliance partners. Importantly, while BA has appeared to concentrate on point–to point traffic, it has not lost sight of the fact that half its long haul traffic does transfer at Heathrow.
The opening of T5 was an unmitigated public relations disaster for both BA and BAA — the failure of the much–heralded high–tech baggage handling system was somewhat redolent of the opening of Denver International or Hong Kong’s Chep Lap Kok, but at least there are no signs of the failures at CDG 2E.
Logistics complexity
The overnight move of the majority of the company’s short haul operations was an incredibly complicated logistic exercise and in the end it is not surprising that there were some initial problems — apocryphally, some of the BA team were advised by their friends at Cathay to stock up with candles in readiness for the opening.
In the first few days after opening the company had to cancel a myriad of flights, while the seemingly ill–trained baggage handlers found it impossible to cope with the new high–tech system creating an apparent mountain of mis–matched bags. Not all of the chaos was BA’s fault: lifts did not work, escalators failed, and Heathrow had suddenly (only days before the opening) found that the planned fingerprint recognition of passengers on domestic flights (which would have allowed the mingling of international and domestic passengers in the same airside departure halls) was deemed illegal.
Nevertheless "questions were asked in the House", and the top management of both BA and BAA were hauled before the House of Commons Select Committee to explain the national embarrassment.
Traffic hit
On the face of it, the impact on British Airways' traffic in this first month of operation has been dire. For April — despite somewhat invidious prior year comparisons because of the timing of Easter, combined with the UK’s decision to delay some school holidays away from the traditional religious period — the company experienced a 7% fall in traffic demand.
In some mitigation at least it saw a modest year on year improvement in "premium" traffic, but the number of people at the back of the aircraft fell by more than 8% year–on–year and the load factor slumped by five points. As a result of the chaotic opening, the second stage of the move into the new facility has been delayed from April to June — the final stage is still slated for March 2009 — which will have a continual knock–on effect on the scheduled transfer times for connecting flights. Incidentally, this also creates further logistical nightmares for BAA as it will delay the planned move by Air France KLM and its SkyTeam partners into T4 and Lufthansa and its Star alliance partners into T1 — both of whom are said to be pursuing the beleaguered BAA for damages.
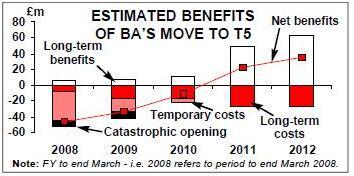
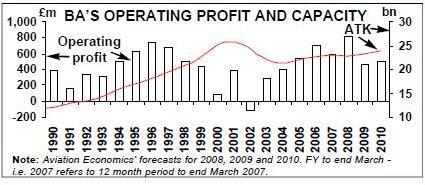
At one point at BA’s Investor Day in March the company highlighted the anticipated long–term benefits of the move to T5 (see chart, above left). One of the most important operationally will have been the opportunity to introduce new working practices (particularly in handling) — many of the old agreements dating back decades appear to have been different by terminal.
In addition, for the first time the flight and cabin crew have their ops–centre within the terminal, voiding the need for the almost off–airport Compass Centre and the requirement to bus the crew to the different terminals; and thus hopefully improving on time performance.
In the run up to full operation of the new terminal the company has had to boost staffing levels strongly at the airport — and has incurred some heavy start–up costs — and these will now start to dissipate. In addition, the heavy capital cost of its own facilities within the terminal will add some £30m to the annual base costs.
One of the major additional benefits — tangible and intangible — will come from the design of check–in hall and the departure process: ranks of automatic boarding pass machines, bag–drops and (as a last resort) check–in–desks that will funnel the departing hordes efficiently (and apparently without queues) towards and through security. The first year’s net impact has been badly hit by the fiasco of the first few days — BA estimates some net additional £16m in costs — but in the long run the net returns should be positive.
Cautious growth
The operational and balance sheet restructuring put in effect since the start of the new century, and now the move into Terminal 5, finally gives British Airways comfort to start reconsidering growth — albeit no more than the industry average. In the short run it still plans only modest capacity increases of just 2–3% for 2008–09 — and with further emphasis on the front–of–the bus as it continues expansion of the new Club World product.
From 2009–10 it appears to be planning a more "normal" growth of 4–5%, with the launch of a new First class product slated for that year. Last September it finally addressed some concerns over the longhaul fleet replacement with an order for 12 A380s and 242 787 Dreamliners (with options for a further seven and 18 respectively) to replace 34 of the airline’s long haul fleet.
These are to be delivered from 2010 (depending on further delays in production of the 787 no doubt) up to 2014; while the company is still considering the options for replacing its last remaining 747s.
The timing of the orders and options gives the company considerable flexibility in its fleet mix and capacity and, through the timing of disposals of the older aircraft, the ability more easily to match capacity to market demand conditions.
Open skies
The second major event of April this year was the start of the first phase of the open skies agreement between the EU and the US. The only thing the US really wanted out of the agreement was access to Heathrow and the dismantling of the Bermuda II agreement — and Heathrow is the Atlantic gateway between the US and Europe. Were it not for the fact that Heathrow is so constrained with its two runways, BA might be seriously concerned.
As it is there has been a rush to acquire slots — at some astounding prices — and a massive switch of capacity into Heathrow (see table, page six). Most of this switch has come from existing routes operated into Gatwick, with the non–Bermuda II US carriers finally able to push routes from their hubs into the airport perceived to have the higher attraction and yields. In fact BA (and partner American) will benefit strongly from the move as it will at last be able to operate the "oil" routes from Dallas and Houston through LHR.
BA superiority
There will undoubtedly be some yield dilution on minor routes, but BA’s control over 40% of the slots at the airport and dominance of the important LHR–NYC route (and New York is by far the gateway on the other side of the Atlantic) gives it an unmatched superiority. The main moves into Heathrow have been from the US carriers forbidden access under the old bilateral — Delta, Continental and Northwest — each of whom have acquired or leased slots from their respective alliance partners. The only European carrier to make a move so far has been Air France/KLM with a (somewhat dubious) rotation from LAX. In the short run this may not represent more than a teaser, but with Delta and Northwest in the throes of merger, the SkyTeam partners gaining ATI, and AF planning a four way joint venture on the Atlantic, the AF move represents a serious bridgehead. Intriguingly, British Midland has decided not to introduce transatlantic services out of Heathrow (at least not yet); but even more danger to BA may be presented by what Lufthansa finally decides to do with its option to buy out Michael Bishop and the resulting combined 20% pool of slots.
However, one of the resulting opportunities of the open skies agreement — especially in consideration of the announced DL–NW merger and the anticipated consolidation of the six US majors into three — will be reopening an ATI application with oneworld partner American (and possibly Continental), and the possibility for being able to create a oneworld–based joint venture on the Atlantic.
This it would follow as long as there were no regulatory penalties imposed (particularly any slot disposals).
"The best laid plans..."
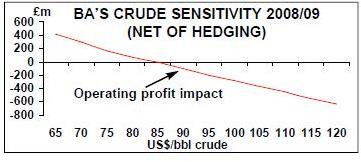
The short–term outlook — and especially that as presented in the company’s Investor Day in March — currently appears to have been eradicated as if by a harvester, and all because of the fuel price. At the time the company was predicating its plans for the current year on a central case of crude oil at $85/bbl and the cable rate at $1.95/£.
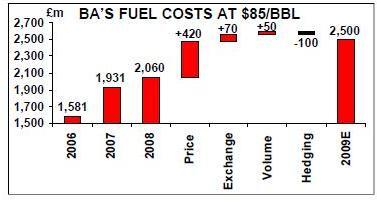
As with the other two European majors — and totally unlike any of the US carriers — BA has a good strong fuel hedging position. In March it stated that it had covered over 50% of its 08/09 fuel uplift requirements at $75/bbl equivalent (through the normal mix of forwards, collars and swaps in what is ironically an un–liquid market); was looking at a possible 4–4.5% revenue growth, a modest uptick in underlying non–fuel unit costs (mainly because of the T5 move) and operating margins of around 7% despite a £500m increase in the anticipated fuel bill (at £2.5bn fuel would represent 30% of total costs).
It also pointed out that in the past it had been able to recover some 60% of the increased fuel costs through fuel surcharges. The CFO did however suggest that at $120/bbl operating profits could be wiped out. The chart (above) shows the sensitivity of the average full year price of crude on operating profits — although as usual sensitivity analyses at a single point in time on a single input variable automatically ignore potential reactions in other variables let alone human intervention (and in the past few weeks many carriers have posted increases in their fuel surcharges) — but the net impact on bottom line profitability may not be the result of a straight line equation.
BA set for the future
Nevertheless the higher the fuel price goes, and the higher the average fuel price through the coming year, the greater the risk to the company being able to generate profits. It has been a long haul for British Airways to get its operations and finances in order. The new facility at Heathrow should at last allow it to recover some if not all of its reputation lost because of the constraints at its main hub. The open skies agreement on the Atlantic may provide some increased competition, but also provides the opportunity to join in the industry consolidation process (particularly on the Atlantic). The spectre of an era of very high fuel prices will harm ability to generate sufficient profits — but, if fuel prices stay at these levels, the industry will have to respond (and we have already seen the failure of some of the weaker carriers to help in the consolidation process).
While there is a very difficult current environment, British Airways is now in a far better position and has much greater flexibility than it had for many years.
| LHR Heathrow |
LGR Gatwick |
STN Stansted |
LTN Luton |
London total |
% of total |
|||||||||||||||
|---|---|---|---|---|---|---|---|---|---|---|---|---|---|---|---|---|---|---|---|---|
| Airport | 2007 | 2008 | % ch | 2007 | 2008 | % ch | 2007 | 2008 | % ch | 2007 | 2008 | % ch | 2007 | 2008 | % ch | |||||
| New York (Kennedy) | 5,883 | 5,940 | 1.0% | 441 | 223 | -49.5% | 187 | 557 | 197.7% | — | — | — | 6,511 | 6,720 | 3.2% | 22% | ||||
| Chicago (O'Hare) | 3,137 | 3,162 | 0.8% | — | — | — | — | — | — | — | — | — | 3,137 | 3,162 | 0.8% | 10% | ||||
| Los Angeles | 2,831 | 3,096 | 9.4% | — | — | — | — | — | — | — | — | — | 2,831 | 3,096 | 9.4% | 10% | ||||
| Washington (Dulles) | 1,972 | 2,261 | 14.6% | — | — | — | 26 | — | -100.0% | — | — | — | 1,998 | 2,261 | 13.1% | 7% | ||||
| San Francisco | 1,744 | 1,744 | — | — | — | — | — | — | — | — | — | — | 1,744 | 1,744 | — | 6% | ||||
| Boston | 1,508 | 1,619 | 7.4% | — | — | — | — | — | — | — | — | — | 1,508 | 1,619 | 7.4% | 5% | ||||
| Newark/New York | 1,378 | 1,835 | 33.2% | 509 | 353 | -30.7% | — | 28 | — | 96 | 191 | 98.8% | 1,983 | 2,407 | 21.4% | 8% | ||||
| Miami | 1,275 | 1,275 | — | — | — | — | — | — | — | — | — | — | 1,275 | 1,275 | — | 4% | ||||
| Seattle/Tacoma | 420 | 580 | 38.1% | — | — | — | — | — | — | — | — | — | 420 | 580 | 38.1% | 2% | ||||
| Philadelphia | 416 | 684 | 64.4% | 268 | 195 | -27.1% | — | — | — | — | — | — | 684 | 879 | 28.6% | 3% | ||||
| Phoenix | 291 | 291 | — | — | — | — | — | — | — | — | — | — | 291 | 291 | — | 1% | ||||
| Denver | 226 | 486 | 115.2% | — | — | — | — | — | — | — | — | — | 226 | 486 | 115.2% | 2% | ||||
| Baltimore | 191 | 191 | — | — | — | — | — | — | — | — | — | — | 191 | 191 | — | 1% | ||||
| Detroit (Metro) | 190 | 200 | 4.8% | 300 | 223 | -25.9% | — | — | — | — | — | — | 491 | 422 | -14.0% | 1% | ||||
| Orlando | — | — | — | 1,135 | 1,232 | 8.5% | — | — | — | — | — | — | 1,135 | 1,232 | 8.5% | 4% | ||||
| Houston (G.Bush) | — | 912 | — | 1,012 | 237 | -76.6% | — | — | — | — | — | — | 1,012 | 1,149 | 13.5% | 4% | ||||
| Dallas/Ft. Worth | — | 474 | — | 719 | 246 | -65.8% | — | — | — | — | — | — | 719 | 721 | 0.2% | 2% | ||||
| Atlanta | — | 216 | — | 716 | 711 | -0.7% | — | — | — | — | — | — | 716 | 926 | 29.4% | 3% | ||||
| Las Vegas | — | — | — | 455 | 455 | — | 45 | — | -100.0% | — | — | — | 500 | 455 | -9.0% | 1% | ||||
| Minneapolis/St. Paul | — | 300 | — | 300 | — | -100.0% | — | — | — | — | — | — | 300 | 300 | 0.0% | 1% | ||||
| Charlotte | — | — | — | 268 | 268 | — | — | — | — | — | — | — | 268 | 268 | — | 1% | ||||
| Raleigh/Durham | — | 249 | — | 249 | — | -100.0% | — | — | — | — | — | — | 249 | 249 | 0.0% | 1% | ||||
| Cincinnati | — | — | — | 215 | 215 | — | — | — | — | — | — | — | 215 | 215 | — | 1% | ||||
| Tampa | — | — | — | 161 | 161 | — | — | — | — | — | — | — | 161 | 161 | — | 1% | ||||
| Cleveland | — | — | — | 113 | 113 | — | — | — | — | — | — | — | 113 | 113 | — | 0% | ||||
| Orlando (Sanford) | — | — | — | 72 | 41 | -42.9% | — | — | — | — | — | — | 72 | 41 | -42.9% | 0% | ||||
| Total | 21,462 | 25,514 | 18.9% | 6,935 | 4,673 | -32.6% | 258 | 584 | 126.3% | 96 | 191 | 98.8% | 28,751 | 30,963 | 7.7% | |||||
| % total | 75% | 82% | 7.8% | 24% | 15% | -9.0% | 1% | 2% | 1.0% | 0% | 1% | 0.3% | 100% | 100% | 0.0% | |||||
| NB New York total | 7,261 | 7,776 | 7.1% | 950 | 576 | -39.4% | 187 | 584 | 212.5% | 96 | 191 | 98.8% | 8,494 | 9,127 | 7.4% | |||||
| % total | 25% | 25% | 3% | 2% | 1% | 2% | 0% | 1% | 30% | 29% | ||||||||||