The SARS effect
May 2003


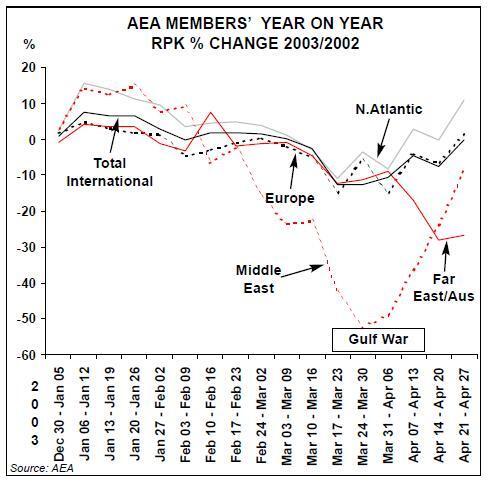
First, the good news. Traffic rebounded after the end of the, relatively short, Iraq war.
AEA monitoring shows growth rates of 11% on the North Atlantic in late April — tentative evidence for our contention (Aviation Strategy, April 2003) that the fundamental links between economic activity and air travel have not been demolished by September 11.
Now, the bad news, SARS is proving to be a biological (or psychological) weapon of mass destruction for the airline industry.
Asian airlines are regularly reporting annual falls in traffic of 30- 50%, while European and US carriers' traffic is down 20–30% on Far East and transpacific routes.
Probably the most dramatic illustration of the SARS effect is the traffic reported by the Japanese airlines for Golden Week, the traditional holiday at the end of April/beginning of May when it seems every single Japanese travels somewhere. JAL and ANA each faced a halving in international passengers, with their load factors plummeting to 41%.
Rumours have circulated that Cathay Pacific, losing HK$23m (US$3m) a day, was going to ground its entire fleet.
These have subsequently been refuted by Cathay, but the projected losses for the year look disturbing: according to Deutsche Bank, Cathay may make a net loss of b e t w e e n HK$4.7bn and HK$8.5bn this year compared to a pre–SARS prediction of a profit of HK$2.2bn.
The one mitigating factor is the ability of some of the Asian majors to react flexibly to the crisis, quickly cutting routes and laying off employees.
Singapore Airlines, for instance, was able to require 6,000 of its employees to take unpaid leave. This means that the date of recovery for the global business has been postponed once more. Just last month we were predicting 3% increase in RPKs this year.
Now we are reducing that to zero, after factoring in three months of full SARS impact on Asian domestic and international routes, Europe- Far East/Australasia and US Pacific operations.
The global surplus will then rise to just over 16% of supply, which is bad news for the lessors, good news for start–ups and expansionist LCCs and another serious blow to the manufacturers.
Asia/Pacific airlines dominate the orderbooks for widebodies, which are most affected by the SARs recession. They are to take well over half the widebodies scheduled for delivery between now and the end of 2004.
The manufacturers until recently were comforting themselves with the thought that the Asian majors unlike their US counterparts were certain to accept the new aircraft on time — now substantial deferrals or cancellations, as signalled by Cathay and Korean, are inevitable.
| 2003-2004 | Total | |||||||
| 747 | 767 | 777 | A300-600 | A330 | A330 | Deliveries | backlog | |
| ANA | 8 | 15 | 23 | 29 | ||||
| JAL | 5 | 16 | 21 | 26 | ||||
| Lufthansa | 10 | 10 | 20 | 35 | ||||
| China Airlines | 12 | 6 | 1 | 19 | 26 | |||
| ILFC | 2 | 8 | 7 | 2 | 19 | 83 | ||
| UPS | 19 | 19 | 64 | |||||
| Air France | 2 | 9 | 3 | 14 | 31 | |||
| KLM | 3 | 10 | 1 | 14 | 19 | |||
| Qantas | 3 | 11 | 14 | 26 | ||||
| Singapore Airlines | 6 | 7 | 13 | 31 | ||||
| EVA | 2 | 10 | 12 | 12 | 17 | |||
| Swiss | 12 | 12 | ||||||
| Asiana | 2 | 6 | 3 | 11 | 14 | |||
| Northwest | 11 | 11 | 32 | |||||
| American | 6 | 2 | 8 | 17 | ||||
| GECAS | 1 | 4 | 3 | 1 | 8 | 16 | ||
| Cathay Pacific | 3 | 3 | 7 | 7 | ||||
| Air Hong Kong | 6 | 6 | 6 | |||||
| Vietnam Airlines | 6 | 6 | 6 | |||||
| Virgin Atlantic | 1 | 5 | 6 | 13 | ||||
| Air Canada | 5 | 5 | 5 | |||||
| China Eastern | 5 | 5 | 5 | |||||
| Singapore Airlines Cargo | 5 | 5 | 5 | |||||
| Others | 2 | 2 | 11 | 0 | 12 | 3 | 30 | 78 |
| Total | 37 | 17 | 98 | 25 | 80 | 51 | 308 | 603 |
| Source: ACAS |