Cathay Pacific: King Hong
Turning the corner?
March 2019


Profit warnings are not unusual. What is rare is for a company to notify the markets that its annual results will be substantially higher than market expectations. And this is what Cathay Pacific did in February this year suggesting that annual profits would approach HK$2.3bn, twice as high as market expectations. Indeed when it published its results in March net attributable profits came in at HK$2.3bn (US$218m) for 2018 up from a loss published a year ago of HK$(1.2)bn.
But Cathay Pacific has had a tough time since the GFC. It last made a decent profit in 2010 — an operating margin of 12% on revenues of HK$89bn (see chart). Since then, it has achieved an average operating margin of a paltry 2.7%, while revenue has grown by an annual average of only 2% a year. The results for 2018 show operating margins of 3% and net margins of 2%. And this is one of the few well-run airline groups based at the heart of the region displaying some of the highest rates of air traffic growth and potential in the world.
These ratios fall far short of a sustainable level of profitability to provide a return to shareholders — and the Swire Group (as major shareholders behind Cathay Pacific) has shown in the past a ruthless attention to returns, albeit within its long term goals as its position as the foremost hong in Hong Kong.
Swires own 45% of Cathay (through separately quoted Swire Pacific) and Air China a further 30%. Qatar Airways also has a 10% stake. Cathay itself has an 18% stake in Air China and 40% share of the Chinese flag-carrier’s freight subsidiary Air China Cargo.
Part of the reason behind this poor performance has been significant losses at the airline subsidiaries — Cathay Pacific and the short haul operation Cathay Dragon. In the two-and-a-half years from the beginning of 2016 the group’s airlines lost a total of HK$8.6bn (US$1bn). Over the same period its subsidiaries and associate company investments (primarily reflecting its stakes in Air China and Air China Cargo) generated profits of HK$6.5bn. And then in the second half of 2018 the airlines finally generated a profit (see graph).
For the whole year 2018 Cathay Pacific generated revenues of HK$111bn up by 15% (finally exceeding the previous peak in revenues in 2014), operating profits of HK$3.5bn compared with a loss of HK$2.28bn in the prior year and net attributable profits of HK$2.3bn (HK$1.3bn).
This was on the back of a 3.5% increase in passenger capacity (in ASK) and a 2.6% increase in cargo capacity; a 3.1% growth in passenger demand (in RPK) and a relatively strong 4.2% improvement in freight demand.
Yields and unit revenues were strong. For the passenger services this translated into a 6.6% increase on a like-for-like basis (management notes that it had refocused yield management towards individual and away from group travel while emphasising strong premium demand on services to Europe and North America) — the adoption of new accounting standard HKFRS15 meanwhile distorts historic comparisons. Cargo unit revenues jumped by 17%: the company highlights increased demand for premium and temperature controlled services, and the success of implementing higher fuel surcharges.
Underlying non-fuel unit costs excluding fuel grew by 1.9% year on year and while the group unwinds out-of-the-money fuel hedges unit costs including fuel increased by 4.8%.
Two years ago the company embarked on a major restructuring programme to return it to a sustainable level of profitability. A large part of this has involved redesigning internal processes, head office organisation and cultural customer-facing reinforcement.
When faced with unacceptable results airlines tend to choose one of two basic courses: trim operations to slim down to profitability; or grow operations to reduce unit costs and hope that unit revenues stay static or improve.
In 2018, Cathay started implementing a new expansion strategy after years of modest growth. It opened ten new destinations — Nanning, Jinan, Brussels, Copenhagen, Dublin, Washington DC, Davao City, Medan, Cape Town and Tokushima — and increased frequencies on popular routes. This year it has introduced services to Seattle and Komatsu. (It meanwhile killed services to Düsseldorf and Kota Kinabulu).
As a result, overall seat capacity (in ASK) grew by a modest 3.5% in 2018, but services on European routes increased by 11% and these routes now account for 21% of total traffic (see graph). Despite this capacity growth, strong premium demand meant that yields on European services were up by 7% on a like-for-like basis while load factors only dipped by 1.3 points to 86.2%.
This increase in services suggest that 2019 will see a surge in growth with capacity set to increase by 6-7% year-on-year. The company guides that this will be heavily weighted to long haul operations (10-12% growth in capacity to Europe, North America and Africa, 5% to North Asia; while regional Chinese, SE and South Asian routes are likely to grow by no more than 2-3%).
In common other Asian network carriers — notably Korean and EVA — Cathay is heavily into freight operations: 50% of its total output is in cargo (see chart). It also has a major cargo joint venture with associate Air China. While cargo operations performed relatively well last year, the company notes that there had been a softening of load factors towards the end of the year: and the current trade war between the US and China is unlikely to help. At the end of 2018 it also acquired the 40% minority it did not own in Air Hong Kong (which operates almost exclusively for DHL) while signing a 15-year agreement to provide wet-lease services to DHL.
Cathay has made significant progress in aligning its fleet and reducing subfleet complexity. The long-haul passenger services are now based on fleets of 33 A330s, 30 A350s (with 16 on order) and 66 777s — the last 747 left the fleet in 2016 and A340 in 2017. It has plumped for the 777X for long term renewal and has 21 of the 777-9X on order to be delivered from 2021. The short haul fleet at Cathay Dragon revolves round the A320 (with 23 in operation and 32 -neos on order) and 25 A330s.
Management refers in the results announcement to 2018 having produced “solid results despite intense competition”. And yet on the face of it Cathay should be in a very strong position. It is the de facto flag carrier for Hong Kong; has strong natural point-to-point O&D demand; positioned strategically in the Greater Bay Area (the megalopolis of the Pearl River Delta with a population of 69 million people); controls nearly half of the slots at HKIA; and, having a reciprocated share swap with Air China, clearly seen to be in favour with the state controlled capitalism in the PRC.
But the airport is running at design capacity and there are significant constraints on airspace infrastructure. Cathay’s record of on-time performance has been deteriorating: ten years ago it achieved a punctuality rate of 86% of flights departing within 15 minutes of scheduled time; by 2017 this had fallen to 71%.
Construction of a third runway as part of the airport’s Master Plan 2030 started in 2016. Expensive and complicated — it will involve the reclamation of 650 hectares of land with a cost estimate of HK$140bn — it is not scheduled to open until 2024.
Competition has been intense, and most of all from mainland China. Cathay may have half the capacity between Hong Kong and mainland destinations, but it has lost out as Chinese aviation has grown. The route between Hong Kong and Taipei used to be the densest air route in the world and a strong one for Cathay as it could provide one of the few ways for connecting the PRC with Taiwan. As the PRC has increasingly opened cross-straits access, this advantage has diminished.
Secondly, the mainland carriers — the Big Three, HNA and their affiliates — have been encouraged to open international routes from cities behind their main hubs in Beijing, Shanghai, Guangzhou and Hainan. In the last ten years international services have grown exponentially: the number of international route pairs out of mainland China has doubled and the number of seats grown by 2.5 times, annual average growth of 10% and 12% respectively.
Cathay has been particularly successful in fending of encroachment by low cost carriers. Jetstar had been trying to set up an affiliate in the region and, rebuffed, gave up the attempt in 2015. Local competition, however, is provided by HNA Group subsidiaries Hong Kong Airlines and LCC Hong Kong Express. These carriers have 10% and 6% respectively of the slots at Chek Lap Kok — the next largest carriers are China Airlines (of Taiwan) and China Eastern each with 3%.
Then at the end of March Cathay announced that it had agreed to acquire Hong Kong Express from the debt-laden HNA Group for HK$4.9bn (US$630m). The LCC has a fleet of 24 A320 family aircraft with eight on order. It operates a handful of routes to South Korea, Japan, Thailand, Taiwan and Vietnam, but lost HK$141m in 2018. Cathay stated that It intends to continue to operate HKE as a standalone low-cost airline.
The group expects to get clearance from the competition authorities and complete the transaction by the end of the year.
The management states that their long term strategy is:
- Relentless focus on customer experience, whilst creating a “through train” of transformative capability to enable continuous productivity and efficiency improvement. (Whatever that really means).
- ASK growth of 3-4% per annum through to the opening of the 3rd runway in 2024. Growing the network and HK Hub in destinations, frequencies and capacity.
- Continued fleet investment in both regional (A321neo’s) and long haul (A350s and 777-9X).
- Build Hong Kong’s position as a gateway airport for the Greater Bay Area (GBA), making HKIA accessible to GBA through improved multi modal connectivity and seamless access.
- Increase the Group’s presence and penetration in the GBA.
- Position the Group to take advantage of capacity increases that arise on the opening of the 3rd runway in 2024.
One would hope that underlying this vision will be a return to a real level of profitability. To do this Cathay needs to return operating margins on the order of the 10% it used to achieve before the global financial crisis. This means tripling the results it achieved last year.
In the 2017 annual report chairman John Slosar stated that “Cathay remains committed to Hong Kong and its people, as it has been for the last 70 years”. As those operating in the Chinese sphere of influence recognise, commitment has a long horizon.
CATHAY PACIFIC GROUP FLEET
| In service | On Order | |||||
|---|---|---|---|---|---|---|
| Dec 2018 | 2019‡ | 2020 | ≥2021 | Total | ||
| Cathay Pacific | 777-200 | 4 | ||||
| 777-300 | 14 | 3 | 3 | |||
| 777-300ER | 52 | |||||
| 777-9X | 21 | 21 | ||||
| A330 | 33 | |||||
| A350-900 | 22 | 2 | 4 | 6 | ||
| A350-1000 | 8 | 4 | 3 | 5 | 12 | |
| Total CX | 133 | 9 | 7 | 26 | 42 | |
| Cathay Dragon | A320 | 15 | ||||
| A321 | 8 | |||||
| A321neo | 9 | 23 | 32 | |||
| A330 | 25 | |||||
| Total KA | 48 | 9 | 23 | 32 | ||
| Cargo fleet | 747-400BCF | 1 | ||||
| 747-400ERF | 6 | |||||
| 747-8F | 14 | |||||
| A300-600F† | 10 | |||||
| Total Cargo | 31 | |||||
| Group Fleet | 212 | 9 | 16 | 49 | 74 | |
Source: Company reports.
Notes: † Operated by Air Hong Kong; ‡ two A350s were delivered in Feb and Mar 2019; three used A330-300 to be delivered 2019.

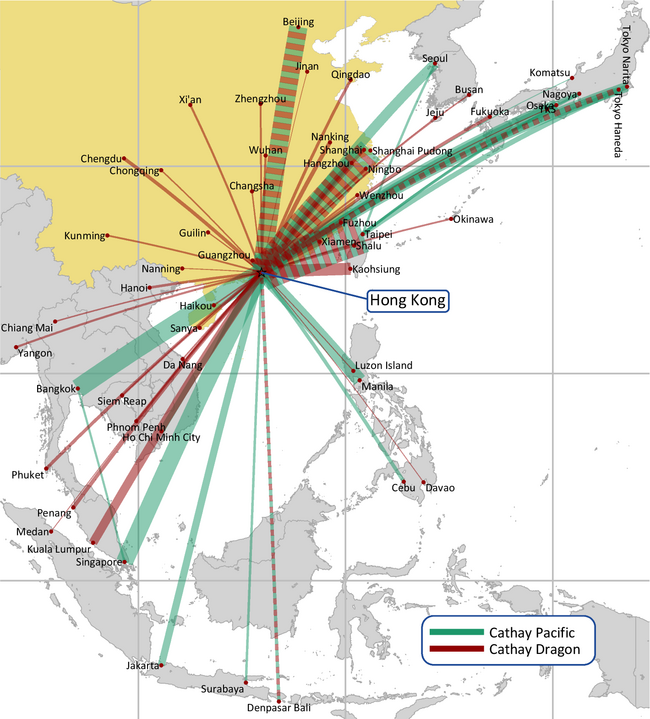
Note: cylindrical equidistant Plate Carrée map projection. Thickness of lines directly related to annual number of seats.

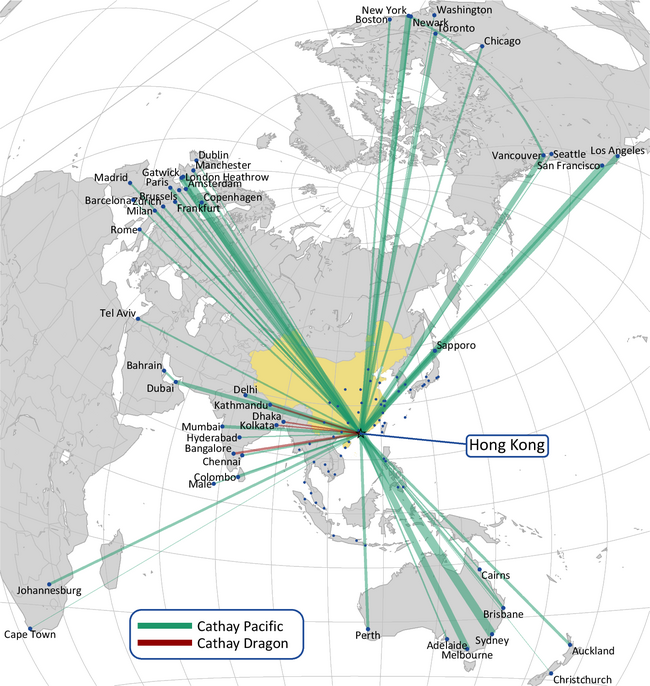
Note: azimuthal equidistant map projection based on Hong Kong (great circle routes appear as straight lines). Thickness of lines directly related to annual number of seats.