ATI: Consumer benefits versus airline profits
March 2010

BA and American have moved close to their long–sought integrated alliance following the US DoT’s decision to tentatively award antitrust immunity (ATI) for the two carriers, plus Iberia, to operate an integrated joint venture on the North Atlantic. The DoT identified a “wide range of valuable benefits” arising from the oneworld alliance, including:
- Lower fares on more itineraries between city–pairs,
- Accelerated introduction of new routes,
- Additional flights on existing routes,
- Improved schedules,
- Reduced travel and connection times,
- Product and service enhancements that can provide full reciprocal access to their networks,
- Efficiency improvements, and
- Fully reciprocal FFPs.
These are essentially consumer benefits. From a company perspective the main benefit from a merger or, in this case, a virtual merger — with the alliance airlines being granted permission to coordinate schedules, capacity and fares without having to worry about US antitrust legislation (or, assuming the EC agrees, European competition rules) — would be the prospect of gaining market share, scheduling domination and pushing up fares. However, it would be totally counter–productive from a regulatory perspective for an airline to admit any such effect, though this is the type of yield enhancement that equity analysts, for example, would be looking for.
The DoT’s role in investigating an immunised alliance is to treat it like a merger, which means assessing whether it is likely “to substantially reduce competition and facilitate (continued on page 2)the exercise of market power”. The DoT, having looked at competition at network, country–pair and city–pair levels, and at the new regulatory conditions under the EU–US open skies agreement and the opening up of Heathrow, decided that any anti–competitive impact of ATI for BA/AA would be mitigated by the compulsory divestiture of just four slot–pairs at Heathrow, with the London–Boston slot being a particular concern. The US DoJ was much more concerned about the competitive impact on the UK–US market — and Virgin Atlantic fundamentally disagreed with this assessment.
Further, the DoT decided that the BA/AA alliance was “likely to significantly reduce fares on interline routes”. This non–intuitive conclusion arises from an academic study of “double marginalisation” — the theory that in a standard interline agreement both airlines will try to maximise their revenue in their respective segments of a flight, rather than maximising the whole revenue of the flight, which they would do under an immunised agreement, and this would lead to the joint fare being higher in the standard interline case than under an ATI alliance set–up. This is a challenging concept whose basis appears to lie in a regression analysis of fares carried out some 10 years ago, and which has been vigorously attacked by ATI opponents.
Alliance results disappoint
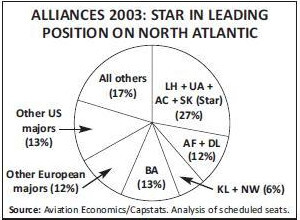
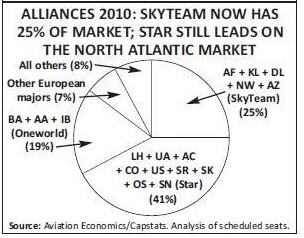
More understandably, the DoT found that the BA/AA alliance would facilitate a third strategic alliance along with SkyTeam and Star. oneworld would become more competitive in key markets and offer increased choice, which as a result would exert “competitive discipline on fares”. In short, an immunised transatlantic oneworld was in the public interest. The conclusion that immunised alliances bring major benefits to consumers is comforting for regulators. Shareholders and financiers might prefer to see evidence that immunised alliances produce benefits on the bottom lines of battered Legacy balance sheets. The cynical view of expanding alliances is that this strategy is a variation on the market share game, which historically has failed to translate size into profits.
The table on page 4 summarises the latest operating results (2008 or 2009) of the global alliances (or rather the airlines adhering to these alliances). The results were not impressive even allowing for the severe cyclical downturn. As yet unimmunised oneworld lost $12.3 per passenger. Star was marginally unprofitable, losing $0.9 per passenger, with airline acquisitions by Lufthansa (Austrian, bmi) depressing the average, and semi–detached carriers like SIA and THY boosting it. SkyTeam’s results are disconcerting as it is regarded as the most fully integrated alliance — an average operating loss per passenger of $8.3 with KL/AF itself losing $26 per passenger (and KL/AF claims that it has achieved $16 per passenger annual synergy gains from the merger).
US carriers helpfully report their Atlantic division results to the DoT. Again the results are disappointing: none of the big three alliance partners — America, United and Delta — got close to break–even on the Atlantic in 2008, despite pushing up yields in response to the fuel price rises. Indeed margins have been thin despite consolidation: from 2004 to the first half of 2009, American produced a cumulative operating profit of $700m (4.5% of revenue), United $608m (4.7%), and Delta (including Northwest from 2008) a loss of $1.17bn (-6.5%).
SkyTeam evolution
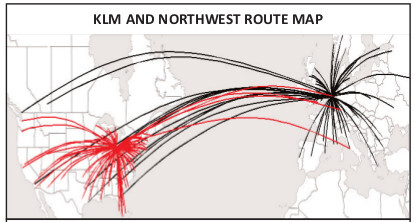
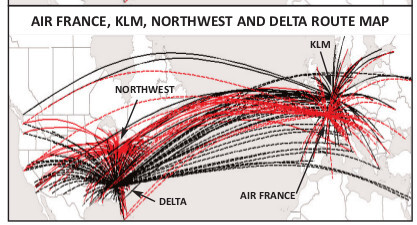
One tentative suggestion for the poor performance of SkyTeam relates to complexity — that the commercial benefits of alliances dissipate beyond a certain point and may reverse because the alliance becomes too unwieldy. KLM was the great innovator in building alliances and discovering the legal potential of ATI, starting with a ground breaking alliance with Northwest in 1989, merging with Air France in 2004 and consummating the Delta/Northwest transatlantic joint venture in 2009. The maps opposite illustrate in a simplified version (excluding the secondary hubs and the Alitalia connection) the evolution of SkyTeam on the North Atlantic.
Linking Amsterdam and the main Northwest hub at Detroit enabled KLM to grow to connect hundreds of small city–pairs, funnelling traffic across the Atlantic via double connections at the two hubs (see top map). KLM was able to grow exponentially along its then–famous S–curve, adding new services and building its wave pattern at Schiphol. To achieve maximum operating efficiency, the joint venture implemented “metal neutrality” — the strategy whereby the alliance members were indifferent as to whose aircraft were used, as the revenue and cost sharing formulae in the agreement distributed the benefits equally between the alliance members. This was a highly effective way of achieving the full benefits of an integrated operation without an actual merger; but it worked because the two carriers had similar cost structures, similar products and the same complementary transatlantic strategy — consolidating thin Europe–US city–pair traffic into profitable volumes by hubbing at Amsterdam and Detroit (and Minneapolis).
However, by the early 2000s the alliance appeared to have run out of steam; in the post–September 11 market, it became increasing difficult to add new services across the Atlantic, revenues slipped and costs escalated.
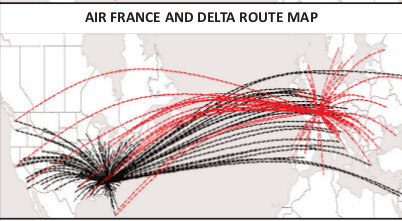
The Air France merger was the solution, and by 2009 the two airlines were one, though considerable management autonomy and distinct brands have been retained. With ATI in place AF/KL are in effect also operating with their US partners, DL/NW, as one airline across the Atlantic. Delta and Northwest themselves completed their full merger last year.
By the bottom map the essential simplicity of KL/NW has been replaced by the complexity of AF/KL/DL/NW. SkyTeam adheres to the principle of metal neutrality as being essential to drive connectivity and efficiencies. But it must have become much more difficult to arrive at mutually acceptable revenue/ cost sharing formulae given the potential for intra–alliance competition between differing hub systems. There is now the original KL/NW hub system concentrating on double connections; the Air France global hub at Charles de Gaulle adding mass and a new range of connections but which now also provides a competing one–stop operation to KL/NW and which has a different passenger profile with more higher–yielding business travellers; the Delta mega–hub at Atlanta provides extensive coverage of the US domestic market but its transatlantic 757s frequently overfly the two European hubs to secondary cities. If Continental had remained in SkyTeam, rather than defecting to Star last year, the picture would have been even more complex.
Alliance dilemmas
For KL/AF there is a particular issue: the five year agreement guaranteeing “balanced development” between the Amsterdam and Paris hubs expired at the end of last year. If the merged entity continues to produce losses at the rate of the last two years, some very difficult route rationalisation questions will have to be addressed: which hub will bear the brunt of any cutbacks? For other alliances the idea of metal neutrality is a non–starter. BA, for instance, considers that its premium long–haul product is somewhat superior to that of American, and would presumably not agree to equal revenue sharing and/or selling the AA product as its own brand.
Airline alliances have been compared to the internet — they offer an amazing range of connecting opportunities, plus perks like integrated FFPs, which consumers/passengers have come to value and eventually to take for granted. The problem in both cases is finding a business model that extracts profits from the network. And alliance airlines face a similar dilemma to that of Microsoft (not that any of them have got remotely close to Microsoft’s financial performance) — if they start to make substantial profits out of an ATI network, they will attract the disapproval of the US and European regulators.
| Airline | Operating profit /pax (US$) |
Operating margin |
|---|---|---|
| Swiss (08) | 34.4 | 9.6% |
| Singapore Airlines (09) | 34.4 | 5.6% |
| Turkish Airlines (08) | 19.9 | 9.6% |
| Air New Zealand (09) | 3.8 | 1.7% |
| Lufthansa (09) | 2.3 | 0.6% |
| ANA (09) | 1.6 | 0.5% |
| US Airways (09) | 1.5 | 1.1% |
| Adria (08) | 1.4 | 0.6% |
| Brussels Airlines (08) | 0.4 | 0.2% |
| Air Canada (08) | -1.1 | -0.4% |
| United (09) | -2.0 | -1.0% |
| Continental Airlines (09) | -2.3 | -1.2% |
| Croatia Airlines (08) | -3.3 | -1.9% |
| Asiana Airlines (08) | -3.4 | -1.2% |
| Air China (08) | -8.0 | -3.6% |
| Thai (08) | -11.1 | -3.3% |
| LOT Polish (08) | -11.4 | -3.8% |
| SAS (09) | -16.3 | -6.9% |
| Blue1 (09) | -18.4 | -11.3% |
| Spanair (08) | -17.6 | -11.5% |
| TAP Portugal (08) | -26.2 | -7.2% |
| bmi (08) | -30.2 | -15.2% |
| Austrian (08) | -42.8 | -12.3% |
| STAR Total | -0.9 | -0.4% |
| LH-UA | 0.1 | 0.0% |
| Aeroflot (08) | 28.2 | 6.9% |
| Czech Airlines (08) | 7.3 | 3.1% |
| Korean Air (09) | 5.1 | 1.4% |
| Delta (09) | -2.0 | -1.2% |
| China Southern (08) | -16.2 | -11.8% |
| Air France/KLM (09) | -26.0 | -6.3% |
| SkyTeam Total | -8.3 | -3.5% |
| KL-AF-DL-NW | -9.4 | -3.8% |
| LAN (09) | 28.3 | 11.8% |
| Royal Jordanian (09) | 27.6 | 8.7% |
| Qantas (09) | 4.0 | 1.4% |
| JAL (09) | -9.6 | -2.6% |
| American Airlines (09) | -11.7 | -5.0% |
| British Airways (09) | -21.7 | -5.6% |
| Iberia (09) | -30.5 | -10.4% |
| Finnair (09) | -33.8 | -9.5% |
| Cathay Pacific (08) | -40.8 | -9.2% |
| oneworld Total | -12.3 | -4.0% |
| BA-AA | -14.4 | -5.2% |