Airline share prices: Up, down and sideways
March 2005

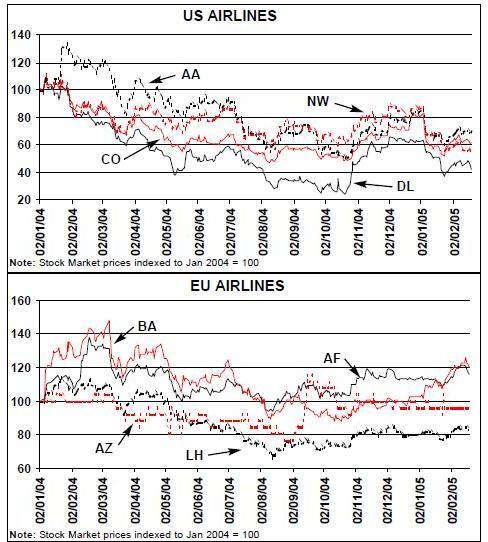
In the following charts we take a sample of the major quoted airlines by region, with a special chart for the top LCCs. We index their share prices to the beginning of last year to show a simple movement comparison.
For the US carriers there has been nothing but further deterioration in sentiment as the markets continue to believe that all the major network carriers will have to file for bankruptcy.
In Europe, there has been more of a mixed view. Here we do at least have some potential for rationalisation and a hope that the industry still has sufficient dynamism to provide returns.
The first real cross border merger came through with Air France’s acquisition of KLM — (although it is still difficult to see that there can be full synergies given the status of the deal).
This has led many observers to put Air France KLM at the top of their stock pick lists. As the chart shows, last year at least, the stock has tracked the path of BA — now regarded by many as stymied in its plans.
For some reason we include the Alitalia share price in the chart — but that, going through another restructuring as it does every cycle, is once again a penny stock making a small movement in the share price equivalent to a large percentage move.
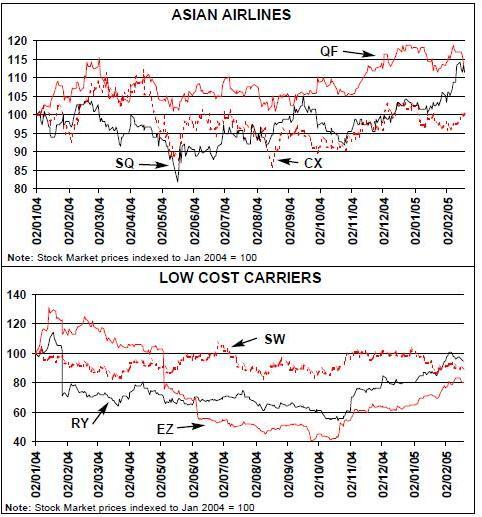
The real loser in the past year has been Lufthansa. Having disposed of some of its peripheral businesses it is still seeing losses in some of its aviation related businesses — holding back earnings recoveryIn Asia contrastingly there has been consistent recovery for Qantas at least, while SIA made a year end recovery and Cathay has gone sideways. All have shown good recovery from the additional Asian problems of 2003 with Qantas in particular showing good cost control.
Of the LCCs Southwest remains a bellwether, the European LCCs, the darlings of the previous two years, have languished.
Both EasyJet and Ryanair continue to increase capacity strongly by 15–20% a year, but have been hit by copycat start–ups and aggressive responses from the network carriers.
The share prices had previously been talked up (mostly in comparison with the dynosaur network carriers) with a certain animadversion to the (particularly European) expansion plans.
In hindsight the markets should have realised that capacity increases imply yield dilution in this most commodity–like of aviation segments. Ryanair was hit first by its announcement of fare wars, easyJet a month later. The easyJet share price recovery towards the end of last year was a result of Icelandair’s taking a 10% stake.
One analyst recently published a report stating that the industry is currently approaching mid–cycle but that there is no overwhelming case for investment based on current valuations (HSBC Global Research "Make Them Sweat — Use what you've got before you get more" January 2005), partly because this cycle is different and that the next peak will show lower returns than previous peaks, partly because current valuations are not far from his "mid–cycle" valuations.
If that is the market consensus then the market may well be in for a pleasant surprise.
Historically in each of the past airline cycles observers have stated that this time the cycle is different.
In each case there has been a 50% fall in share prices from peak to trough and 100% rise from trough to peak.
The industry always lives in interesting times and its shareholders get a roller coaster ride.