Market balance and the great unanticipated adverse event
March 1998

In our first issue (November 1997) we looked at the outlook for the global market balance for the aviation industry, reviewing the forecast produced by ESG (which we regard as the industry-standard forecast) but providing a more pessimistic alternative as we suspected that ESG’s demand assumptions were extending the strong upturn too far. By plugging in a cyclical slowdown in 1999 and 2000, we came up with a significantly larger surplus than ESG but, nevertheless, concluded that there was probably no need to worry too much about market balance.
That was five months ago and since then we have had the great unanticipated adverse event — the Asian financial crisis — which has overturned many of the assumptions underlying steady growth forecasts (and also our cyclical down–turn scenario). By contrast, the build–up of military activity in the Gulf is hardly being considered as a factor shaping the future supply/ demand balance despite the fact that the 1991 Iraqi war directly caused an unprecedented fall in air traffic.
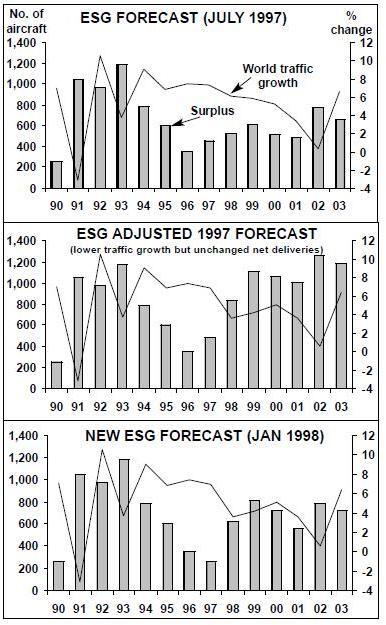
ESG has now updated its market balance forecast (although the full forecast only appears in the July issues of Airline Monitor). Some remarkable changes have been made.
Previously Asia/Pacific traffic was expected to grow at 9.3% p.a. during 1997–99; now growth is cut right back to zero for this year and 3% for 1999. Thereafter traffic growth does resume but the "lost" passengers are not recovered. In terms of the global market, the Asian effect is to depress demand growth to 2.2% in 1998, 3.6% in 1999, and 4.7% in 2000. In the July forecast the growth rates were 6.1%, 5.8% and 5.2% respectively. (For comparison, IATA has just reduced its forecast of Asia/Pacific traffic growth from 7.7% p.a. for the period to 2001 to 4.4% p.a.).
If the new growth rates were to be applied mechanically to the July forecast the result would be a surplus of 8–10% for the period up to 2005 — in other words a greatly extended version of the deepest recession to hit the aviation industry. Happily, ESG’s new forecast (January 1998) does not show this scenario as it has made some important adjustments.
ESG observes that the Asia/Pacific airlines will need to add only 250 jet aircraft during 1997–2000, 370 less than the 620 estimated last July. The question then becomes: who bears the pain — the airlines through overcapacity and lower yields and load factors, the second–hand market through an influx of aircraft and lower prices, or the manufacturers through cancellations and postponements?
ESG isn’t explicit on this impossible query, but the numbers show a reduction in deliveries of 190 units for 1997–2000 compared with last July. Boeing and Airbus certainly haven’t acknowledged this scenario yet.
Another worrying factor is the continuing stubbornness of the global retirement schedule. ESG admits that 1997 retirements may be well turn out to be 140 less than the total forecast but is persisting with its July 1997 retiral rates.
Finally, ESG assumes that the Asian crisis is self–contained and does not spread to Europe or North America. Certainly, in the early 1990s recession Asia remained insulated from the trauma in the rest of world, producing 7%-plus growth rates while traffic stagnated or declined elsewhere. But since then deregulation has removed or at least lowered the bilateral barriers which controlled capacity shares and prevented regional surpluses from spreading to other parts of the world. Aviation Strategy argued in the last issue that Western airlines were almost inevitably going to be tempting by the supply of relatively cheap widebodies coming onto the market directly or indirectly from Asian airlines.
In summary, under these assumptions, ESG puts the world surplus at 5–6% over the next three years, up from 2% in 1997. In number terms the surplus is greater than that of the early 1990s.
ESG comments: “History tells us that whenever [the surplus] becomes more than 6% of the fleet we are in a problem area while above 8% is a real danger zone. Today there is a real risk that the 1999 surplus could become greater than 8% of the fleet. Our yellow caution light is starting to blink in shades of red.”
Reality check
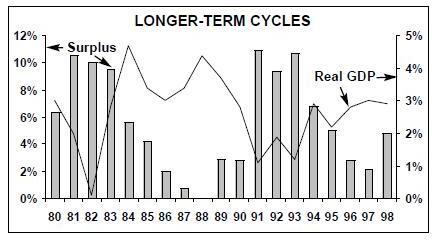
So an objective analysis of the global supply/ demand position strongly suggests that the industry is slipping into a significant surplus. Chart gazers contemplating longer–term cycles (see graph, above, sourced from ESG and the OECD) would probably conclude that a turning point had been reached and passed.
Yet it is very difficult to detect any major concern among the managements of European and American airlines. On the contrary, confidence, buoyed by a series of record profits, has rarely been higher. There may be an element of self–delusion in this, but there are also good reasons for the industry’s confidence.
First, consumer confidence is generally high (despite the high levels of structural unemployment in countries like Germany and France). The OECD in its latest Economic Outlook sees real private consumption in the main economies continuing to grow at reasonably strong and sustainable levels.
Second, load factors have reached record levels and probably cannot be pushed up much further. Hence there are no obvious indicators of over–capacity from the markets.
Third, when capacity is added it will be added in a much more controlled manner than in previous cycles. BA’s request for tender for 100 short–haul jets emphasises this approach: it is demanding maximum flexibility in moving the new aircraft into and out of its fleet.
Fourth, global alliances represent another method of controlling capacity, as airlines have not had to build up their own fleets to expand into new markets. And should growth rates falter, the members of the alliances should be able to co–ordinate the required adjustments in capacity.
| Estimates & projections | |||||||
| 1993 | 1994 | 1995 | 1996 | 1997 | 1998 | 1999 | |
| US | 2.9 | 3.3 | 2.4 | 2.6 | 3.3 | 3.1 | 2.4 |
| Japan | 1.2 | 1.9 | 2.0 | 2.8 | 1.4 | 1.7 | 2.0 |
| Germany | 0.1 | 1.2 | 1.9 | 1.3 | 0.9 | 1.9 | 2.2 |
| France | 0.2 | 1.4 | 1.7 | 2.1 | 0.6 | 2.2 | 2.3 |
| Italy | -2.4 | 1.4 | 1.8 | 0.7 | 2.0 | 1.9 | 2.1 |
| UK | 2.5 | 2.8 | 1.7 | 3.5 | 4.4 | 3.7 | 2.3 |
| Canada | 1.6 | 2.9 | 1.4 | 2.4 | 4.0 | 3.1 | 2.9 |
| Total | 1.6 | 2.5 | 2.1 | 2.4 | 2.5 | 2.6 | 2.3 |