JAL and ANA: Zen and the Art
of Airline Maintenance
June 2021

As they emerge from the pandemic JAL and ANA seem set on preserving their domestic market as an island of competitive tranquillity while moderating, as far as is possible, the impact of further incursions from foreign carriers in their international markets.
Japan’s experience of Covid-19 has been different from that of Western countries. Vaccination rates until very recently have been very low but so has been the Covid mortality rate (about 5% of the UK’s rate, for example). A national lockdown has not been imposed, apparently because it would be unconstitutional, but most prefectures introduced local restrictions, and international travel to/from the country has been very severely curtailed.
Remarkably, the Olympic Games will go ahead in July, albeit with few spectators. The airlines and airports had been gearing up for the Olympics for some years, but the crowd-free event may not be a serious blow — the boost to traffic demand from such events is usually well overestimated — and, in any case, the lost Olympics business has been swamped by the Covid effect.
In FY2020 (year to March 31, 2021) ANA reported a 75% collapse in overall passenger numbers, to 13.1m from 52.3m, with domestic passengers down 71% to 12.7m and international passengers down 96% to 0.4m. JAL’s percentages were almost the same: overall passenger volume down 72% to 12.6m from 45.4m, with domestic passengers down 74% to 12.2m and international passengers down 96% to 0.4m. For the record, the annual systemwide passenger load factors for ANA and JAL were 34.8% and 36.6% respectively.
Domestic traffic is recovering — by mid-year schedules had been restored to about 70% of 2019 levels, and both carriers are relatively optimistic about this market, with ANA projecting a return to 2019 RPKs by the end of 2022, JAL by 2023 or 2024. International is much more uncertain — ANA estimates 2023 as the full traffic recovery year; JAL is more tentative, indicating that volumes will not get back to 2019 levels until 2025.
Repairing the financial damage is going to be even more problematic. ANA recorded a ¥545bn ($490m) pretax loss in FY2020, a -84% margin on revenues. JAL’s pretax loss was ¥404bn ($364m), a -75% margin.
The impact on cashflow is summarised in the tables. Adjusting the reported loss for depreciation and other items to obtain operating cashflow roughly halves the PBT losses, but, even with Capex rigorously cut back, Free Cashflow was ¥-310bn at JAL and ¥-866bn at ANA (inflated somewhat as this includes ANA’s purchase of financial bonds).
In the summer of 2020 the Japanese airline industry made a joint request, through the Scheduled Airlines Association, to the government for aid to survive the Covid crisis, but the government has been remarkably reluctant to provide direct loans or grants to the airlines, though it has supported regional airports which in turn have cut landing fees, and the airlines have had access to general furlough schemes. A large part of this reluctance stems from the 2010 experience of having to bail out JAL to the tune of ¥350bn. Just before the pandemic struck, the JAL President, Yuji Akasaka, was still apologising for that episode, stating in an interview with the Japan Times: “We caused trouble to many parties concerned, including our shareholders, related government agencies and ministries, as well as partner financial institutions.”
The impact of the 2010 JAL bankruptcy and the subsequent restructuring and recapitalisation was seen as detrimental to ANA — in the period 2016-19 its pre-tax profit margin averaged 6.9% against 10.4% at JAL. The government has attempted to redress this situation by restricting the award of new routes to JAL and generally favouring ANA in new slot allocation at Tokyo Haneda.
Pre-pandemic competition between the two airlines was controlled, both officially and informally, by the powerful Ministry for Land, Infrastructure, Transport and Tourism (MLITT), to the extent that the Covid crisis led to speculation at the end of last year that a full-scale merger between JAL and ANA was possible. The suggestion came from a close advisor to the new Prime Minister Yoshihide Suga, who raised the idea of major capital injections from the state into the airline industry, on a Lufthansa-type scale, and stated that “ANA and JAL should come together at this time.”
The precise meaning of this exhortation is unclear, but there would appear to be little logic for such a merger, given the level of collusion between the two carriers and the potential logistical nightmare in operational terms. Moreover, the Japanese banks and investment community have been more than willing to support the two carriers. Almost 90% of ANA’s shares and over 75% of JAL’s are Japanese owned, and in both companies roughly half the Japanese holding is from individual investors.
JAL and ANA appear to have coordinated their respective rights issues at the end of 2020 and the beginning of 2021 which raised ¥183bn for JAL and ¥298bn for ANA. In addition, JAL in FY2020 raised a net ¥206bn in debt while ANA increased its borrowing by a remarkable ¥802bn. The major Japanese banks are almost obliged to support the national carriers. And the monetary stimulus policy of the central Bank of Japan means that it not only buys government and corporate bonds but also invests in shares — it now owns about 7% of the Japanese equity market.
The fund raising has left the two carriers with reasonably solid balance sheets — as at March 2020, a debt/equity ratio of 1.1/1 at JAL and 2.2/1 at ANA — and enough cash on hand to absorb another 12 months of 2020-type losses. In fact, ANA is officially forecasting break-even at the net profit level for FY2021. JAL hasn’t yet come up with a forecast.
Japan’s economy pre-pandemic was characterised by a 20 year deflationary period with insipid real GDP growth and zero or negative price inflation rates — perhaps a vision of the future for some European economies. There was only a minor recovery from the Global Financial Crisis, with GDP growth averaging 1.1% during 2014-19 before falling by 4.8% in 2020. Nevertheless, it should not be forgotten that Japan is still the third largest economy in the world (after the USA and China), and its GDP per capita, $45,000 in 2019) is one of the highest in the world. Plus it ranks very highly on most social indicators, and it is a fascinating country.
Closely related to its weak economic performance is Japan’s demographic profile. The country’s population peaked around 2010 and has started to decline, a trend which is expected to accelerate throughout this century, with the working age population being supplanted by retirees — see chart.
This is the set of problems that Abenomics (named after Prime Minister Shinzo Abe who retired earlier this year) was supposed to resolve through structural reforms, increased labour market flexibility, encouragement of inbound tourism and an inflationary fiscal policy, but which has had only limited success. ANA and JAL have to find post-Covid strategies to meet the same challenges.
Visions and markets
JAL’s mission statement in its medium term management plan, evidently losing something in translation, is: “To become the world’s most preferred and valued airline group, where many people and goods lively move around” — an almost zen-like aviation vision. ANA proclaims its aim of being: “The world’s leading airline group in customer satisfaction and value creation”.
Before looking at how JAL and ANA intend to realise these lofty aspirations it is worth reviewing the relative sizes and competitive structure of Japanese aviation markets. The bar chart and the pie charts are constructed from pre-Covid (2018/19) schedules, cover all Japanese and foreign airlines and are measured in one-way seats.
Domestic
The Japanese domestic market is huge in terms of seat capacity — pre-Covid the annual total was around 159m seats or 75% of the total Japanese air transport market. In revenue terms the domestic market accounts for about 53% of both ANA’s and JAL’s total passenger revenues.
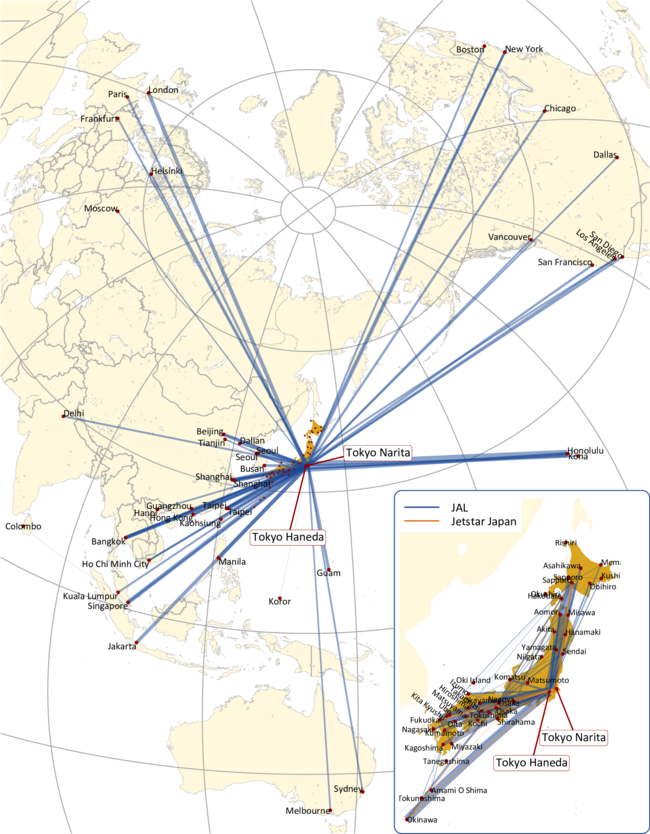
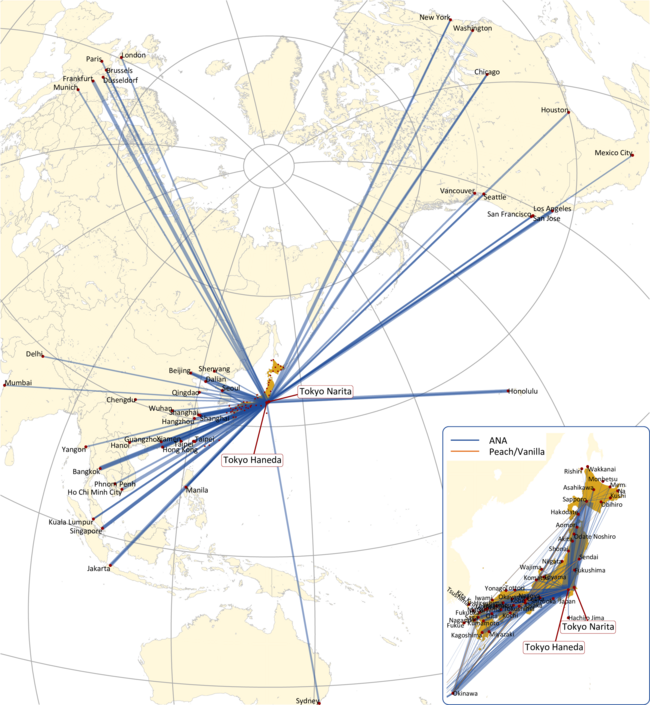
Only about a third of this capacity is on routes to/from Tokyo Haneda and Narita, the rest is flown between the other 70-plus cities. The average sector length is about 940km yet nearly 40% of domestic capacity is provided by widebodies, 50% by narrowbodies and the rest by RJs and turboprops.
As the pie chart shows, the two carriers and their subsidiaries (more on the LCCs below) control 80% of the market, with ANA being the dominant force. For both carriers, the domestic market is vital for their long-term survival and has to be impregnable.
The 20% of capacity offered by other airlines does not represent real competition. ANA has extensive codesharing agreements with, and holds minority stakes in, the significant regional airlines — IBEX, AIRDO, Solaseed and Star Flyer. And these regionals have responded to the Covid crisis by consolidating — AIRDO and Solaseed will complete a merger in 2022.
China
The government’s tourism plan envisaged an increase in tourist arrivals from 30m in 2018 to 60m by 2030. Despite the pandemic that target is still regarded as realistic and most of the increase is to come from Mainland China.
In this market JAL and ANA risk being overwhelmed by the Chinese Majors (Air China, China Southern, China Eastern and Cathay Pacific) and the dynamic new entrants (notably Spring Airlines). The two Japanese airlines had only 25% of the market pre-Covid; to retain this share in the future ANA is relying on Peach and JAL on Spring Japan (see LCC section below).
South Korea
Almost as large as China in seat capacity, the South Korean market has very different characteristics. Korean Air’s Incheon hub competes directly with Narita and Haneda for connecting medium/long-haul traffic, and much of its traffic to/from Japan is feed. Following the takeover of Asiana last year Korean has potentially increased its share of the Japan-Korea market to nearly 40% leaving just 10% for JAL and ANA.
This is also an important market for the other Korean carriers which provide nearly half the capacity — LCC-types like Jeju Air, Jin Air and T’Way Air dwarf Peach on Korea-Japan routes.
South East Asia
This is a leisure-orientated market with strong Japanese outbound tourism, which JAL and ANA intend to exploit through their new medium haul subsidiaries.
The market is volatile. Pre-Covid JAL and ANA had about 29% capacity while the SE Asian flag carriers took 44%. But it is not all certain that the likes of MAS, Garuda, PAL and Thai will survive the Covid crisis. And AirAsia X is the largest of the LCCs that accounted for 19% of the market.
North America
About 30% of this market is to the classic honeymoon resort of Honolulu, with flights operated by Hawaiian, JAL, ANA, various associated Japanese charters and in the future by the new medium/long-haul brands.
The other 70% covers routes from Japan to all the major US and Canadian cities. This is a market largely operated under antitrust-immunised, deep codesharing agreements whereby the Japanese and US carriers in effect operate as one airline on scheduling, pricing, etc. JAL plus American have 30% of the market, ANA plus United about 37% — in short, this is a controlled market for the Japanese carriers (the other US major Delta has its immunised agreement with Korean).
Europe
Japan-Europe too is characterised by deep alliance agreements, but is more diverse. Paris is the favoured destination for Japanese tourists, and Air France is the largest airline on the Japan-Europe market, with 13%. However, JAL and IAG (mostly BA) combined account for 19% of capacity, while ANA plus Lufthansa Group airlines take 36%. Again, this is, on a country pair basis, a controlled or controllable market for JAL and ANA.
Elements of their strategies
Against this background, the key elements of JAL and ANA’s current strategies are condensed below.
Japanese version of low cost
LCCs were an alien concept in the Japanese market until about ten years ago when JAL and ANA started small scale experiments with lower cost associates, setting up joint ventures with established operators, notably Air Asia and Jetstar/Qantas. The idea promoted by the MLITT was for the Japanese carriers to examine all aspects of established LCC models, take the best bits and build a super-efficient Japanese version.
The LCC policy was linked to the new policy of privatising regional airports, of which there are about 90 in Japan. By observing European experience, it became clear that without an LCC presence there would be little impetus behind traffic growth at the airports.
However, the JAL/ANA instinct to control competition appears to have prevailed. Most of the LCCs that emerged — Vanilla, Peach, Jetstar — were partly owned by ANA or JAL, and certainly were not allowed to expand in a rapid LCC manner or compete vigorously against the incumbents. The LCC share of the Japanese domestic market peaked at about 15% in 2019 but since then the pandemic has accelerated the trend to concentration around the two mainstream carriers and elimination of independent LCCs.
AirAsia Japan, a joint venture between AirAsia and Japanese partners, closed at the end of 2020, and will not resume operations. Jetstar Japan closed down too at the end of 2020, although temporarily, with its A320s being repatriated to Australia. Spring Airlines Japan, a subsidiary of the Chinese LCC with an initial 5% stake from JAL, was taken over by JAL last summer.
JAL and ANA now have parallel LCC strategies. JAL has three business models:
-
Jetstar: Focusing on domestic leisure routes with a fleet of 22 A320s and utilising Australian marketing and revenue management expertise.
-
Spring Japan: Using Spring’s brand to bring in Chinese tourists to Japan, flying 737-800s.
-
ZIPAIR, a new medium/long-haul venture using 787s — ten aircraft are planned for 2024 — on leisure-orientated routes to/from Hawaii, California and SE Asia.
ANA, meanwhile, is promoting:
-
Peach: Positioned as “the LCC market leader”, and since 2019 incorporating Vanilla, Peach is expected to expand from 35 A320s today to a maximum of 40 by the end of 2022, consolidating its position domestically, with some international expansion into SE Asia when its two postponed A321LRs are delivered. At the same time, ANA plans strengthen cooperation between Peach and the mainstream airline, coordinating schedules and, presumably, pricing.
-
“Third Brand”: As yet unnamed, this will be a 787 operation to the same markets as JAL. The main source of cost saving relative to the mainstream airline would appear to be seat density — the low cost 787 will have 300-plus seats (though still offering two cabins) against 169-240 seats on the existing international 787-8s.
So the Japanese LCC sector remains relatively small-scale and tightly bound in with their parents. Despite exploring Western LCC operations in detail, there is little of Southwest in the LCC units, let alone Ryanair. Indeed, the Japanese strategy appears to be a variation on SIA’s multi-brand operation (SIA, SilkAir, Scoot), though it may prove superior to SIA’s.
While emphasising the (modest) expansion of the LCCs, the two carriers are also promoting new, if a little obscure, enhancements to their full-service products. ANA has set up a “Regional Revitalisation Company” which will assign “concierges” to solve local issues. JAL has ambitions to capture more international connecting business traffic over its Narita hub through “leveraging joint ventures” (presumably with its oneworld partners, BA, American and Finnair).
Fleet shrinking
Both carriers have short/medium term plans to reduce the overall sizes of their fleets (see chart), relative to 2019 through the disposal of older widebodies.
JAL’s planned fleet for 2023 is 229 units, down from 241 in 2019. 26 777s are being taken out of the fleet to be replaced on domestic routes by A350-900s. 350-1000s are due to make their appearance in 2023, replacing 777-300ERs
ANA’s planned fleet for the end of 2022 is 275-280 units, down from 303 in 2019. It has accelerated the retirement of 17 777s and 767s as well as 18 737s and A320s. Scheduled deliveries of 787s and A320neos have been postponed, and its final A380, colourfully paint-jobbed for the Hawaiian market, remains temporarily in France.
Labour relations and cost flexibility
Japanese labour relations contrast with those in the Western corporate world. Despite Covid and the planned downsizing JAL has not reduced at all its 35,600 workforce. It has redeployed surplus employees from the main airline to new business units, seconded them to other companies and encouraged them to go on training and educational programmes.
In the recovery phase there will be no net increase in employee numbers though the company expects productivity improvements by shifting employees from declining to expanding units within the corporation (in contrast to IAG’s strategy of moving capital from declining to expanding units). JAL continues to highlight what it calls its amoeba management system, under which “every employee strives to contribute to increasing profits by maintaining a steady focus on maximising revenues and minimising expenses” (whether workers care to be likened to amoeba is open to question).
ANA is as usual is little more prosaic. It plans a 4,000 reduction on workforce from 46,500 to 42,5000 by the end of 2022. But this reduction will be effected through natural retirements, voluntary retirements and curbs on graduate hiring.
It had to suspend winter bonuses in 2020, the first time since 1962, which is significant as bonuses, summer and winter, make up about a quarter of annual income, and the decision did seem to be genuinely traumatic for the management : “I feel very sorry, as the decision has a big impact on your life,” said ANA Holdings CEO Shinya Katanozaka in a statement to employees.
Both airlines promise that they will emerge from the Covid crisis with more flexible cost structures. ANA states that it will change the ratio of fixed to variable costs from 60/40 in 2019 to 50/50 in the “mid term”; JAL intends to retain its fixed costs at 2020 levels throughout the recovery period. They reference renegotiated supplier contracts, new labour agreements, fleet renewal, etc, but it is difficult to see how any fundamental change can be made given the fixed nature of labour costs at the companies, or, to put it another way, their long-term commitment to harmonious labour relations.
Nebulous Lifestyle
Asian network carriers — not just JAL and ANA but also Cathay Pacific and SIA — have latched onto the idea that they can exploit their passenger databases to become quality service companies rather than just airlines. Air Asia too has been a strong proponent of this concept.
Looking at JAL’s “Path to Profit” plan, it is apparent that “Mileage and Lifestyle” is expected to be a more important generator of profits than LCC growth or FSC revenue enhancement. M&L includes finding new partners for the FFP programmes, and expanding into banking services, insurance and equity trading,
It may all seem a bit nebulous, but there is potential in Japan because this country, surprisingly, lags well behind the West in online retail and e-commerce. And the US Legacies have demonstrated over the past year how to successfully monetise Loyalty Programmes.
SDGs by 2050
JAL and ANA of course espouse SDGs (Sustainable Development Goals) as being of equal importance to ROIs or ROEs. They both commit to achieving net zero CO2 emissions by 2050, but are not being radical in the short/medium term.
JAL’s 2030 target is to keep emissions below 90% of the 2019 level (which shouldn’t be difficult given the modest expansion plans). ANA has a long history of experimenting with bio-fuels, but it is only committing to maintaining emissions in 2030 at a lower level than in 2019. It all seems a bit underwhelming.
Overall JAL and ANA will emerge from the Covid crisis through collaboration rather than competition. They are both essentially conservative, dedicated to preserving the status quo. The share chart indicates that the stock market has taken a more or less identical view of the two carriers. Recent performance has been rather weak, but the chances are that both carriers will still be around in 20-years’ time.
| FY (Apr 1-Mar 31) | 2016 | 2017 | 2018 | 2019 | 2020 | Total 5 years |
|---|---|---|---|---|---|---|
| Revenues | 1229.0 | 1383.0 | 1487.0 | 1385.9 | 481.2 | 5966.1 |
| PBT | 162.8 | 162.5 | 156.2 | 88.1 | -404.1 | 165.5 |
| Operating Cashflow | 253.2 | 281.5 | 296.7 | 80.8 | -219.5 | 692.7 |
| Capex | -233.1 | -208.0 | -222.1 | -239.6 | -89.6 | -992.4 |
| Other Income (Expenditure) | 65.0 | 41.4 | 32.4 | 5.9 | -1.4 | 143.3 |
| Free Cashflow | 85.1 | 114.9 | 107.0 | -152.9 | -310.5 | -156.4 |
| Increase (decrease) in debt | -7.2 | -1.4 | 5.9 | 1.7 | 205.9 | 204.9 |
| Equity inflows | 182.7 | 182.7 | ||||
| X-rate effects | -0.3 | -0.4 | -1.2 | 1.1 | -0.8 | |
| Dividends paid | -46.3 | -54.4 | -42.9 | -40.5 | -184.1 | |
| Total Cashflow | 31.3 | 58.7 | 70.0 | -192.9 | 79.2 | 46.3 |
| FY (Apl 1-Mar 31) | 2016 | 2017 | 2018 | 2019 | 2020 | Total 5 years |
|---|---|---|---|---|---|---|
| Revenues | 1765.3 | 1971.8 | 2053.3 | 1974.2 | 728.7 | 8493.3 |
| PBT | 139.5 | 196.6 | 154.0 | 51.5 | -545.4 | -3.8 |
| Operating Cashflow | 237.1 | 316.0 | 296.1 | 130.2 | -270.4 | 709.0 |
| Capex | -224.9 | -265.5 | -336.8 | -317.6 | -134.1 | -1278.9 |
| Other Income (Expenditure) | 30.3 | -59.0 | 28.1 | 87.4 | -461.5 | -374.7 |
| Free Cashflow | 42.5 | -8.5 | -12.6 | -100.0 | -866.0 | -944.6 |
| Increase (decrease) in debt | 20.8 | -9.0 | -26.4 | 49.0 | 801.7 | 836.1 |
| Equity inflows | 296.4 | 296.4 | ||||
| X-rate effects | -1.9 | 0.3 | -0.3 | 2.6 | 0.7 | |
| Dividends paid | -17.5 | -21.0 | -20.1 | -25.1 | -83.7 | |
| Total Cashflow | 43.9 | -38.5 | -58.8 | -76.4 | 234.7 | 104.9 |
| ¥bn | End March 2021 |
|---|---|
| Fleet assets | 1045.4 |
| Investments etc | 494.1 |
| Cash | 408.3 |
| Other current assets | 159.5 |
| Total Assets | 2107.3 |
| Long term debt | 495.6 |
| Retirement liabilities | 153.2 |
| Current liabilities | 476.9 |
| Total Liabilities | 1125.7 |
| Shareholders' Equity | 981.6 |
| ¥bn | End March 2021 |
|---|---|
| Fleet assets | 1446.3 |
| Investments etc | 533.1 |
| Cash | 464.7 |
| Other current assets | 763.7 |
| Total Assets | 3207.8 |
| Long term debt | 1530.5 |
| Retirement liabilities | 161.7 |
| Current liabilities | 503.4 |
| Total Liabilities | 2195.6 |
| Shareholders' Equity | 1012.2 |