Flybe continues search for profitable role
June 2018

Europe’s leading regional carrier, Flybe, is attempting to find a clear strategy in a small but complex market, and to achieve at least a break-even financial result.
Flybe’s latest financials (to end March 2018) showed another loss, the norm for the past eight years. Total revenue increased by 6% to £752.6 and the headline pre-tax loss was more than halved from £19.9m to £8.1. Unfortunately, this loss reduction was only on paper. Operating losses grew from £2.4m to £13.5m. Changes in non-cash items, mainly the valuation of dollar loans into sterling and a provision for Embraer 195 leases, were positive relative to the previous year, hence the apparent net loss improvement.
Almost 90% of Flybe’s revenues come from its regional operations using Q400s, Embraer 175s and 195s, the rest from a rolling wetlease contract with SAS for its ATR72s, its maintenance subsidiary FAS and airport agreements that support some developing routes.
Flybe has been cutting back capacity, but only slightly in 2017/18 — to 12.6m from 12.7m seats — though this year could see a reduction of up to 7%. Passenger volume grew by 7.7% to 9.5m passengers, which meant that Flybe achieved its target of a substantial improvement in load factor — from 69.6% to 75.6%.
With a slight improvement in passenger yield, unit revenues per seat rose by 9% to £58.7, but still not enough to cover operating unit costs of £59.7.
The revenue/cost equation is proving very tricky for Flybe, and indeed all regional airlines. On the unit revenue side there is a limit to which regionals can push up load factors largely because it is difficult to stimulate traffic on their routes; finding particular routes that command high business travel yield is possible, but building a network on this basis has proved impossible. For intra-UK flights Flybe is obliged to add £26 in government tax (APD) at least to its round-trip prices.
On the cost side, there are various realities which frustrate regional airline from replicating LCC metrics. The complexity of the network relative to the passenger volume is core. Turboprops and regional jets cannot match A320-type aircraft operating costs. Without volume growth it is difficult to strike deals with airports, and the pricing structure of larger airports, Heathrow especially, discriminates against smaller aircraft. Even crew costs can be a problem because of heavy personnel churn as pilots want to advance to narrowbodies at mainline carriers.
The balance sheet as at March 2018 showed £244.1m of long-term liabilities and £93.0m of shareholders funds, which is almost exactly Flybe’s stockmarket value, suggesting that investors are not anticipating a growth into profitability.
As with many companies, Flybe’s current positioning is the result of the conflicts of history. Here is a brief resumé.
Flybe started operations in 1979 as Jersey European Airways based in the Channel Islands, flying inter-island routes and to the UK mainland. It was acquired in 1983 by multi-millionaire Jack Walker and re-based to Exeter, eventually renamed as British European. After a series of losses in the downturn at the beginning of the noughties it reinvented itself again as Flybe, attempting to combine elements of the short haul legacy business model with LCC practices.
In 2007 it acquired BA’s regional operation, BA Connect, for a negative price. BA effectively paid £130m to Flybe and took a 15% equity stake in the airline, now reduced to zero, to ensure the disposal of its loss making UK regional services.
In 2010, Flybe floated on the London Stock Exchange, valuing the company at £215m and raising £60m but shares sank rapidly after numerous profits warning. CEO Jim French departed in 2013 with some controversy regarding his pay package. Former easyJet COO Saad Hammad was brought in to implement a radical management culling and route restructuring plan, with some operational success but still no profits. He did however oversee the raising of a further £150m in equity.
By late 2016 Hammad was on his way out, again with a generous package. Christine Ourmières-Widener, ex-CityJet, the Air France owned regional carrier based at Dublin, which had faced a plethora of issues, and is now solely a wet lessor, was appointed as the new CEO of Flybe.
Under the new regime Flybe emphasises its role as a connecting airline for its 11 codeshare and interlining partners, which are Air France, BA, Cathay Pacific, Virgin Atlantic, Alitalia, SIA, Emirates, Etihad, Air India, Finnair and Aer Lingus. According to the airline’s Chairman, Simon Laffin: “In the UK, Flybe is the pre-eminent regional connector. We have developed our interlines and codeshares better to tap into long-haul airline hub connectivity”.
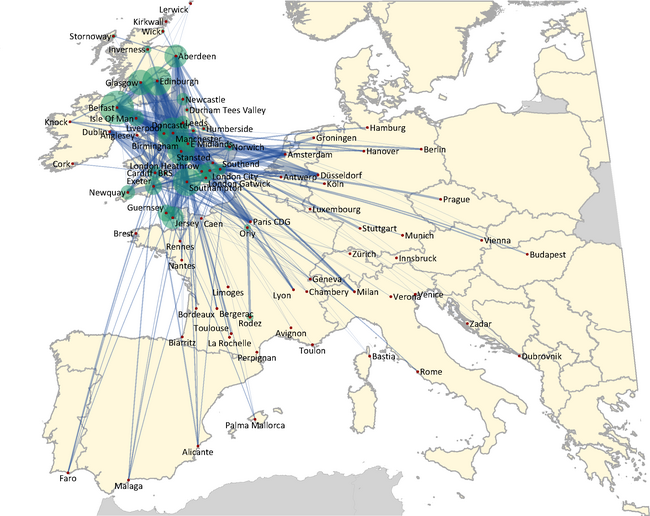
Slightly surprisingly this strategy is not elaborated upon in the company’s presentations, and it is difficult to ascertain just how much connecting traffic Flybe generates. As the graph illustrates, Flybe’s network is built on its bases at UK regional airports, and its “hubs” at Manchester and Birmingham, though in total it serves 80 points, 31 in the UK and 49 in continental Europe. Some 72% of its total capacity is deployed to/from the UK bases (plus Dusseldorf). There are undoubtedly connecting possibilities at its main UK bases from, say, an Emirates flight to Manchester and onward on a smaller UK city, but this is very much a niche operation rather than a core strategy.
According to our analysis only about 8% of Flybe’s seat capacity is allocated to routes to/from major European hubs — Amsterdam and Paris CDG — where it could connect to massive long-haul networks. But then Flybe comes into direct competition on routes between the UK and these continental hubs with the regional subsidiaries of its code share partners, KLM Cityhopper and Air France’s Hop!,
Flybe made the decision last year to take up some ex-bmi slots to launch services to Heathrow from Edinburgh and Aberdeen with the intention of feeding its seven codeshare partners that operate to the global hub. But on the Scotland-LHR routes it has to compete directly against codeshare partner BA on price, frequency and flight speed. In a recent presentation at the Heathrow Connectivity conference, Flybe stated that it wanted to grow at Heathrow, then added with a capitalised BUT, that it needed to obtain favourable slots, reduced airport charges and reform of APD.
The two pie charts give an indication of Flybe’s competition; they show seats and flights operated on Flybe’s network by Flybe itself and by other carriers. Flybe does have a dominant position, with a 59% seat share and 66% flight share, but perhaps not as much has might be expected for a carrier that aims to control a range of thin or niche routes. Other regionals account for some 5% but more than half of this is operated by Eastern Airways, with whom Flybe signed a franchise agreement last year, and most of the rest is flown by Loganair, the Scottish regional, whose franchise agreement with Flybe was terminated last year.
The Euro-majors, or their regional subsidiaries, offer the main competition, on 28% of the network. As noted these are codeshare partners but there is no prospect of their outsourcing these operations to Flybe.
Interestingly, Flybe has succeeded in mostly avoiding direct competition with LCCs on its network. Only easyJet has a sizeable presence. However, the regional dilemma remains: if a regional succeeds in developing a thin route, it will inevitably attract a voracious LCC onto that route.
Management at the airline strongly hint at future consolidation in the regional airline sector, but it is difficult to see how this will be accomplished. Earlier this year Stobart Air, operator of Southend airport and franchisee for both Flybe and Aer Lingus, offered to buy out Flybe but its undisclosed bid was rejected as being too low.
bmi Regional has a similar model to Flybe operating mostly smaller Embraers, 135s and 145s, and there is little network overlap. For the latest financial year available, to March 2017, its parent company, AIL, made a loss of £3.2m on revenues of £182.1m. Could there be some elusive synergies there?
The Euro-majors have been retreating from the regional sector so they are not candidates. Nor, as far as we can ascertain, are the myriad small turboprop operators throughout continental Europe.
Perhaps there is no grand strategy possible for Flybe. Its future depends on concentrating on protecting its core routes and bases and tackling costs, which is what Christine Christine Ourmières is attempting through her Sustainable Business Improvement Plan (SBIP). This covers what one might expect — sales and marketing drives, cost improvement, operational and organisation excellence, new technology, employee engagement and customer satisfaction. The devil is in the implementation details.
At the core of the plan is a rationalisation of the fleet following “extensive studies” of the route and aircraft operating economics. From a peak fleet of 85 units in 2017 the aim is to reduce to 70 units by early 2021, with all the 9 Embraer 195s, on which Flybe has made an onerous lease provision, are to be returned to the lessor. This leaves the Q400s as the core aircraft in the fleet (55 units at present), despite concerns about reliability. These will be complemented by Embraer 175s (11 at present with scheduled deliveries for four more) which can operate longer routes and are interchangeable with the Q400.
In short, Flybe is aiming to shrink to break-even.
Notes: Based on estimated 2018 schedules Capacity is seats offered to/from each base (ie Manchester includes MAN to/from AMS and Amsterdam includes AMS to/from MAN) Other airlines operating on FlyBe routes only