SAS Group's restructuring plans: A, B, C ...
June 2003

First quarter 2003 results for the SAS Group reveal that losses are increasing despite significant restructuring and cost cutting in 2002. Can the multinational company, Europe’s fourth largest airline group, ever overcome its high cost base, or might it be forced into selling off parts of the SAS empire?
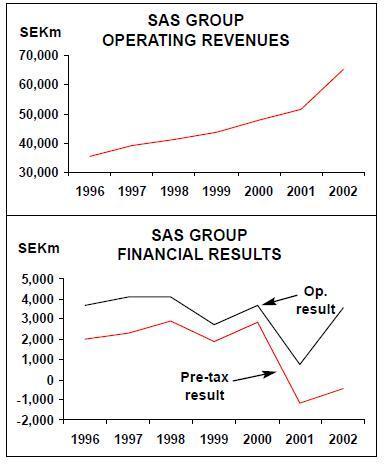
In the first three months of 2003 the SAS Group reported an operating loss of SEK1.9bn (€210m), compared to a loss of SEK1.4bn in 1Q 2002). The Group made a net loss of SEK1.6bn (SEK1.3bn loss in 1Q 2002). The figures make grim reading for a company that underwent substantial changes supposed to bring it back into profit for the first time since 2000.
It wasn’t supposed to be this way. The Group managed to significantly reduce its pre–tax loss in 2002 (see graph, p.10) and it was hoping to achieve a positive result in 2003 after overhauling its complicated capital structure, strengthening its grip on the Scandinavian market (through, notably, the acquisition of Braathens) and implementing cost–cutting (see Aviation Strategy, February 2002).
Plan C
In April 2002 SAS announced what it called Plan C — yet another round of substantial cost–cutting to come on top of Plans A and B (see below). Plan C is designed to take out another SEK8bn (€884m) from annual costs, which it claims will reduce unit costs by 30%.
The measures will be carried out over an 18 month period, according to SAS Group, and include:
- Adjusting collective agreements with pilots and cabin crews, including an increase in the pilot working week from 42 to 45 hours, a pay freeze for pilots in 2003 and 2004, and further redundancies. Target cost saving on collective agreements = SEK1.5bn, on "production" = SEK900m and on "in–flight" = SEK1bn.
- Restructuring airline support businesses, including redundancies, outsourcing of certain ground services, concentrating aircraft maintenance at Stockholm Arlanda (with almost 1,000 redundancies) and reducing travel agent commissions on ticket sales. Target cost saving = SEK3.4bn.
- Reducing administration and other overhead costs at Scandinavian Airlines by 40-50%, including making half of the 1,000 administration staff at the airline redundant. Target cost saving = SEK600m. Overhead costs will also be reduced on group–wide functions. Target cost saving = SEK600m.
Altogether, Plan C includes another 4,000 redundancies, on top of more than 6,200 already taking place over 2002–2005 and announced last year (although despite deep cuts in Scandinavian Airlines' staff through 2002 the Group still had 35,000 employees as of the first–quarter 2003 — almost identical to the figure for 1Q 2002 — due to staff expansion elsewhere). So far unions have largely accepted these restructurings, but staff morale is believed to be at an all–time low.
SAS estimates that the Plan C measures will increase Group earnings by around SEK400m (€44m) in the fourth quarter of 2003, with the full SEK8bn savings not filtering through until 2005.
Of the other ongoing cost–cutting initiatives, perhaps the most urgent is reducing the fleet and the bewildering number of aircraft types (see table p.11). Of the total Group fleet of 311, 195 belong to Scandinavian Airlines, which the Group estimates is still 36 too many for its capacity plans going forward. Nine of these are leased out at present and 25 other aircraft will have to be either be leased out or sold. Scandinavian Airlines currently has nine aircraft on firm order, mostly A321s and 737- 800s. The four A321s were part of a firm order for 12 placed in 2000, but after eight were delivered the last four were deferred for delivery in 20005/06. One A 3 3 0 — 3 0 0 remains to be delivered from an order for four made in 2000.
The nine outstanding orders will cost the Group US$342m in Capex over the next few years, after deposits have been taken into account.
In future, new aircraft orders may be made in co–ordination with other Star alliance members, although SAS is not expected to place any further orders anytime soon.
At the other Group airlines — Braathens, Spanair, Wideroe and Air Botnia — further cost cutting will generate an extra SEK1bn in annual savings by 2005, the Group claims.
The core problem
So will this additional cost cutting be enough to restore profitability to the SAS Group? It is clear where the problems at the SAS Group come from. On its own, despite accounting for just 41% of operating revenue in 1Q 2003, Scandinavian Airlines was responsible for SEK382m of the Group’s SEK 398m operating loss before depreciation and leasing costs (a 96% ratio), and SEK1.3bn of the Group’s SEK1.9bn pre–tax loss (67%). In full–year 2002 the rest of the SAS Group (i.e. excluding Scandinavian Airlines) actually made a SEK 582m pre–tax profit, but this was wiped out by Scandinavian Airlines' pre–tax loss of SEK1,032m (€114m). And it was a similar situation in 2001 as well, with main airline pre–tax losses of SEK1.5bn swamping a SEK359m profit at other Group activities.
In contrast to Scandinavian Airlines, the Group’s other carriers performed well last year. 2002 operating profits of SEK774m, SEK164m, SEK83m and SEK22m were posted respectively at Braathens, Wideroe, Air Botnia and Spanair, though it must be noted that, like Scandinavian Airlines, all of them had a rough first quarter in 2003.
Of these subsidiaries, Norwegian carrier Braathens is the biggest contributor to the bottom line. Wholly acquired in December 2001, it ensures that the SAS Group has a firm grip on the Norwegian market. Braathens has a fleet of 27 737s and is now expanding its European leisure routes, with Rome, Palma, Las Palmas and Dublin being added this year. Norwegian regional Wideroe, which the SAS Group has controlled 99% of since June 2002, is a domestic short–haul specialist with a fleet of 29 Dash 8s, while Air Botnia is a Finland–based feeder carrier with 10 RJ85s and Saab 2000s.
In the long–term, perhaps the greatest potential of all the subsidiaries lies in SAS’s Spanish subsidiary.
The SAS Group now owns 74% of Spanair, which started off as a charter carrier back in 1986 but now 75% of its flights are scheduled. With 50 aircraft based in Madrid and Barcelona, Spanair — which joined Star in April 2003 — is now the second–largest airline in Spain and is a low cost operator compared with Iberia. Spanair dropped long–haul routes in early 2002 in favour of code–share deals, instead concentrating on opening new European routes. However, domestic Spanish traffic is still the largest market for Spanair, accounting for 75% of total scheduled RPKs in 2002.
The success of the other parts of the Group means that if Scandinavian Airlines was disposed of, the Group would in theory turn in a healthy profit. That may not be so outlandish given the February appointment of Soren Belin — previously a consultant at Booz Allen & Hamilton — as COO and vice president.
The Group also separated operations into five distinct business units from July 2002 — Scandinavian Airlines, Subsidiary & Affiliated Airlines, Airline Support Businesses, Airline Related Businesses, and Hotels — which means that not only can individual performances be compared but also allows the possibility of selling off units in the future.
For political reasons Scandinavian Airlines could probably never be sold off, but Belin is likely to take a consultant’s view of where (and where not) Scandinavian Airlines is adding value to the SAS Group.
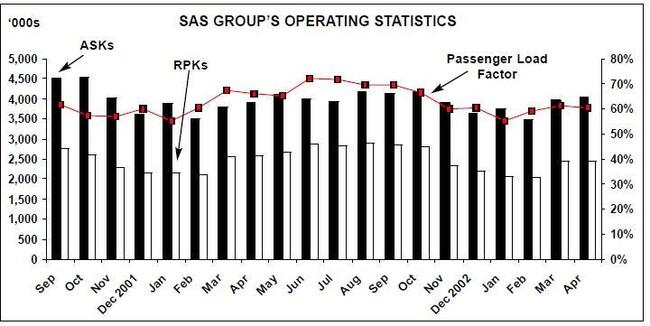
In the first quarter of 2003 the main reason for the poor performance of Scandinavian Airlines was a continuing fall in yield, which was 9% lower than 1Q 2002.
The Group claims much of this is due to expansion of long–haul routes with A330/340s (which depresses average yields) and on this sector ASKs grew by 20% over the period and RPKs by 9%. But, worryingly, yield erosion was also seen on European and intra–Scandinavian routes, with respective declines of 5% and 4% in the year–on–year first quarter.
On these sectors the airline has cut capacity significantly but RPKs have declined even faster. In Europe the Group cites the weak economy and uncertainty over Gulf War II, while on intra–Scandinavia the Group blames weak economies and cuts in feeder routes.
But it is not falling yield that is the core trouble for SAS — after all, yield erosion is being experienced by most other European airlines at the moment — but rather it is high unit costs.
SAS Group estimates that Scandinavian Airlines is 25–40% less efficient than the best airlines in Europe, and this difference is largely due to aircraft and crew utilisation, overhead costs and the complexity of the airline’s route network, all of which are key target areas for cost–cutting. As an intermediate measure Scandinavian Airlines aims to reduce its maintenance and ground service costs by 10–15% from 2002 levels, increase aircraft utilisation from 7.5 block hours per day per aircraft in 2002 to 9 hours; and raise crew utilisation rates from 490 block hours per pilot per year in 2002 to 600 hours.
SAS is also trying to substantially reduce its distribution costs as a proportion of passenger revenue. In 1999 it was 20% and though it had fallen to 16.4% by 2002 the Group believes it is still too high. The target for 2003 is 13%, which SAS hopes to achieve through greater internet distribution and the introduction of "net sales".
At present travel agents account for 79% of passenger revenue but the aim is to increase internet sales from their current 5% share to 25% by 2005. Net pricing on travel agent sales was introduced from start of 2003, in line with what is increasingly common practice elsewhere in Europe. Instead of tickets being sold by travel agents at one standard price, with agents then taking off a 4–7% commission, from now on S c a n d i n a v i a n Airlines sells tickets to agents at a net price, allowing agents to vary the ticket price to customers depending on the level of services they require.
A flaky idea?
The latest part of the effort to reduce SAS’s high cost base is — almost inevitably — the launch of its own low–cost carrier (LCC): the imaginatively named "Snowflake". This started operations at the end of March 2003 and has already achieved a 72% load factor in April according to the SAS Group.
Snowflake uses four 150–seat 737–800s borrowed from the main airline and will operate on 15 European routes from Copenhagen and Stockholm by the end of 2003. Most are of these are holiday destinations not currently served by Scandinavian Airlines, although Snowflake will also serve some non–traditional destinations such as Beirut and Belgrade.
Plans are also in place for operations out of Oslo Gardermoen for the winter 2003/04 timetable, where another 737–800 would be based in order to serve five or six destinations.
As well as the aircraft, flight crew and other personnel are transferring across from Scandinavian Airlines, which raises the question: how much lower will Snowflake’s costs actually be compared with Scandinavian Airlines?
Snowflake could be regarded as being not so much part of a cost–cutting drive, but as a marketing exercise that mops up some of the Group’s excess capacity. Certainly Snowflake does little to combat the aggressive conversion of Stockholm Skavsta into Ryanair’s latest min–hub from April 2003.
The LCC now offers more than 30 flights day to six new routes out of Skavsta — Aarhus, Glasgow, Hamburg, Paris, Oslo and Tampere — in addition to existing routes to Frankfurt and London. With more than 100 staff and a fleet of four 737–800s at Skavsta (located 100km south of Stockholm). Ryanair’s intention is clear — it is targeting SAS passengers, whom Michael O'Leary, Ryanair CEO, says have to "put up with SAS’s high fares monopoly".
Ryanair’s Skavsta move may have encouraged Scandinavian Airlines to restart international routes from Stockholm Bromma airport, situated close to the city centre, from May 12 for the first time in 41 years, although again this will do little to dent the advance of Ryanair.
The Snowflake move is essentially part of a change in Scandinavian Airlines' market strategy responding to the increasing weakness in business traffic. While SAS remains the Euro–major with the highest proportion of business traffic, this dependence is a key weakness when economies are under pressure.
In March, in order to revive weakening business traffic, the airline introduced four tiers of business fares, two of which offer business–type flexibility and frequent–flyer benefits but in economy seats.
On major European business destinations SAS intends to strengthen its network of non–stop services, but on "smaller" business destinations the airline may be less aggressive, particularly as it cuts back its excess capacity.
In addition to these moves in the business market, SAS Group has taken a strategic decision to add price–sensitive European leisure travellers as another core target market, joining European business, long–haul business and intra–Scandinavian. SAS Group estimates it has a 37% market share of the outgoing Scandinavian leisure market and just 20% of tour operator package flights, but Snowflake and the expansion of leisure routes at Scandinavian Airlines and the other airline subsidiaries should improve those percentages.
Whether this will prove to be a strategic overstretch remains to be seen.
SAS is also feeling pressure on the intra- Scandinavian sector. With the Group cutting intra–Scandinavian capacity by 18% in 1Q 2003, regional rivals have been quick to step in. Stockholm–based Skyways Express (25% owned by SAS) has increased its fleet to 28 aircraft, while Varmlandsflyg is also expanding services in response to SAS’s reduction of capacity. In response, SAS started negotiations to buy Maersk Air’s 49% stake in Estonian Air, which — strategically — could sit well alongside SAS Group’s existing 47% investment in Air Baltic of Latvia. However, talks are currently on hold. SAS has withdrawn from a possible bid for Lithuanian Airlines after deciding prospects for the privatising airline were not great.
In March 2003, SAS Group sold its 26% stake in Danish regional airline Cimber Air, which operates domestic Danish and Germany routes. Interestingly, SAS’s reasons for the move included the fact that the Danish market provided only limited feed to SAS hubs. SAS is also considering selling its 37.5% stake in Air Greenland, presumably for the same reason as for its exit from Cimber Air.
Where next for SAS?
SAS Group’s management is confident that the extra cost cutting and the expansion into the leisure market will be enough to reverse the mounting losses.
Plan A, which started in autumn 2001, has now been completed and is on target to save SEK6.4bn by 2005. Plan B, which aims to cut another SEK6.4bn by 2005, is less than two–thirds complete but will save SEK3.2bn in 2003. With Plan C adding another SEK8bn, the total cost–cutting target by 2005 is a hefty SEK21bn (€2.3bn). Jorgen Lindegaard, SAS Group CEO since May 2001, says that the plans are "about achieving changes that are absolutely essential and achieving them fast" and he is “convinced that the ability to do this exists in the organisation".
The obvious criticism is why didn’t the Group start substantial cost–cutting earlier, before September 11 even, as British Airways had the foresight to do? In any case, equity analysts in particular will be benchmarking the progress of Plan C against BA’s "Future Size and Shape Plan", which is currently ahead of schedule in some key areas. And what if the Plans don’t go to plan, so to speak? Will there be a Plan D or E? A worrying statement from the Group said that the company’s result for the rest of 2003 is "impossible to predict". Whatever the current trading climate, every other airline manages to come up with forecasts for the year ahead, so why not SAS?
Strategically, it is almost impossible for the SAS Group to escape its high cost base in northern Europe. SAS’s complicated share structure which leads to complicated business and union structures (39 unions within the group) further exacerbates matters.
Despite an attempt to expand into leisure traffic the Group is essentially a niche airline, based on dominating the Scandinavian market and carrying large amounts of business traffic. With Scandinavia under increasing attack from LCCs and others, and business traffic dependent on the economic cycle, there is little room for manoeuvre other than to attack costs as much as possible. No matter how much outsourcing it carries out or how many redundancies it makes, SAS Group will never become a low–cost carrier. The Star alliance is some help, with interline revenue accounting for 10% of passenger revenue at Scandinavian Airlines in 2002, but this cannot compensate for SAS’s structural disadvantages.
If the cost cutting does not produce fast results the pressure will mount on SAS Group’s management. On April 11, Moody’s downgraded SAS Group’s credit rating to Ba1 — not a healthy sign for a company with a net debt of SEK21bn (€2.3bn) as at March 31 (an increase of SEK3bn in just three months) and with a net cash outflow from operations of SEK1bn in 1Q 2003. SAS Group’s own key target — a minimum CFROI (cash flow return on investment) of 20% a year — appears far away, with a CFROI of 11% in April 2002- March 2003.
Having made some key appointments in 2002, the Group reorganised senior management yet again in early May 2003. If results keep deteriorating then long–suffering investors — who haven’t received a dividend since 2000 and who have seen SAS’s share price plunge from SEK143 in 1998 to around SEK30 at the end of May 2003 — may demand a cull of senior management similar to that seen among its employees.
The only other alternative would the sale of some of SAS Group’s five business units.
| Leased | Leased | Orders | |||
| Owned | in | Total | out | (Options) | |
| A320 | 8 | 8 | |||
| A321 | 8 | 4 | 12 | 4 (8) | |
| A330 | 2 | 1 | 3 | 1 | |
| A340 | 5 | 2 | 7 | (7) | |
| 717 | 4 | 4 | |||
| 737-400 | 4 | 4 | |||
| 737-500 | 14 | 14 | |||
| 737-600 | 12 | 18 | 30 | ||
| 737TBD | (9) | ||||
| 737-700 | 8 | 7 | 15 | ||
| 737-800 | 14 | 5 | 19 | 4 | 4 |
| 767-300 | 3 | 6 | 9 | ||
| MD-81 | 5 | 10 | 15 | ||
| MD-82 | 17 | 26 | 43 | ||
| MD-83 | 2 | 22 | 24 | 1 | |
| MD-87 | 10 | 6 | 16 | ||
| MD-90 | 8 | 8 | |||
| RJ-85 | 5 | 5 | |||
| ERJ-145 | 3 | 3 | |||
| F28 | 7 | 7 | 2 | ||
| F50 | 7 | 7 | 2 | ||
| Q100 | 16 | 1 | 17 | ||
| Q300 | 8 | 8 | |||
| Q400 | 10 | 18 | 28 | ||
| Saab 2000 | 5 | 5 | |||
| Total | 134 | 177 | 311 | 9 | 9 (24) |