Manufacturers agree to disagree on demand for large aircraft
July 1999

Boeing and Airbus unveiled their latest market forecasts at the Paris Air Show, and not surprisingly agreed to disagree on the most contentious part of the jet market — demand for large capacity aircraft.
Although Aviation Strategy is sceptical about the worth of market forecasts from parties with much to gain from what the figures say (i.e. the manufacturers), it is nevertheless interesting to note the similarities and differences between Boeing and Airbus’s latest analyses.
Firstly, though, a word or warning. Direct comparisons between the two forecasts can be misleading since, interestingly, the two define the jet market in different ways. For example, Boeing includes 50–seat regional jets (such as the Embraer 145) but Airbus only includes 70–seaters upwards. Boeing excludes Russian aircraft such as the Tu- 134, Tu–154, Yak–42, IL–62 and IL86, while Airbus includes them. There are many other differences as well, but it would take most of this article to list them.
Perhaps most irritating of all, the manufacturers do not give out precise breakdowns of their forecast by all aircraft, as the tables on these pages show (and these forecasts are presented exactly as released by the manufacturers). So Airbus, for example, lumps all aircraft in each seat category other than those named in an “other” total. Boeing is an even worse offender, as it lumps all aircraft together in seat categories, and gives no individual numbers at all. At least the two manufacturers are now considering the same period (1999- 2018) — this didn’t use to be the case!
The forecasts
Airbus’s 1999 Global Market Forecast forecast (which can also be seen on the Internet via www.airbus.com) can be summarised as follows:
- The passenger jet fleet will grow from 9,993 in 1998 to 18,020 in 2018, and the dedicated freighter fleet will grow from 1,453 aircraft to 3,422.
- Over the period 8,907 passenger aircraft will have to be “replaced”. Of these, 3,252 will be “recycled” back into the active fleet with other operators and 2,305 converted into freighters. 3,350 passenger aircraft will be retired, along with 1,086 old freighters.
- 15,518 new aircraft will be delivered over 1999–2018, worth approximately $1.29 trillion in 1999 prices.
- The average number of seats per passenger aircraft will rise from 180 in 1998 to 218 be the end of 2018.
Boeing’s 1999 Current Market Outlook (available on www.boeing.com) can be summarised as:
- The total jet fleet (passenger and freight) will increase from 12,578 in 1998 to 28,422 in 2018. The proportion of regional aircraft (50- 106–seaters) will rise from 10% to 17%.
- Over the period 4,306 aircraft will be retired.
- 20,150 new aircraft will be delivered over 1999–2018, worth $1.38 trillion in 1998 prices. 4,116 of these will be regional aircraft.
Differences on large aircraft
The area where the two manufacturers are most divergent in their views is very large aircraft. Quite simply, Airbus believes there is a substantial market (and that’s why it is developing the A3XX), and Boeing doesn’t. Boeing can justify its viewpoint by empirical observations. Because of the fragmentation of long–haul markets and the popularity of twin–jets, the average size of aircraft in the global fleet has actually been declining over the past ten years. Airbus essentially is saying that this trend has to come to end at some point largely because of the constraints on airport capacity, and at that point the only way of meeting demand on trunk intercontinental routes will be with the new super–jumbos.
Airbus reckons there will be demand for 1,924 aircraft of 400 seats or more over 1999–2018 (and a whopping 1,256 aircraft of 500 seats or more).
Boeing on the other hand believes there will be demand for just 933 aircraft of 400 seat size and above over the same time period. 1,924 versus 933 aircraft is a massive difference, but the accuracy of these forecasts is crucial, as in effect Airbus will be betting the company if it decides to develop an A3XX family (which would cost an estimated $12bn).
If Airbus goes ahead with its new models and its forecast is right, then Boeing may become a permanent number two in the jet market and would be very unlikely to catch up. If Airbus is wrong, then the mistake may be fatal to the consortium/SCE. A launch decision for the A3XX is expected in the second half of 2000, depending on commitments from potential customers.
The traffic outlooks
Taking a step back, and looking at the manufacturers’ forecast traffic demand (where all aircraft figures are, theoretically, derived from), there are again significant differences in methodologies. However, they can be overcome to some extent by focussing on RPK growth over the total time period concerned (1999–2018).
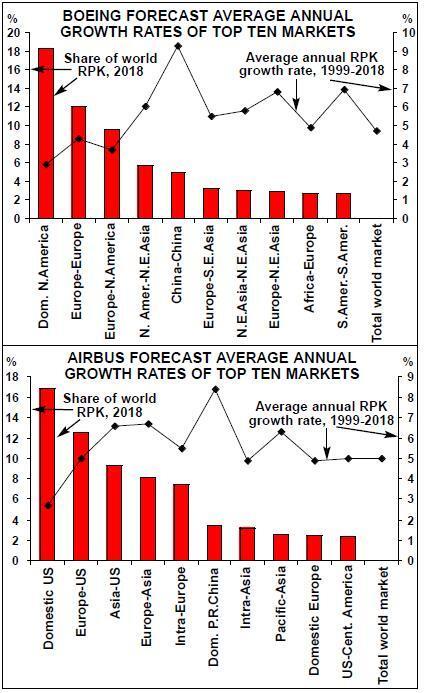
The graphs on the left include a comparison between Boeing and Airbus’s traffic forecasts by region. Although there are some differences in regional definitions (e.g. Airbus divides out the US and Canada while Boeing doesn’t, and Boeing divides Asia into smaller regions, while Airbus doesn’t), a consistent pattern emerges.
Domestic North America will remain the largest market in the world over 1999–2018, but it is mature and has the lowest growth rate of the top 10 markets. On the other hand, the domestic Chinese market will be the fastest–growing over the next 20 years, with an average annual growth rate of 9.3% according to Boeing and 8.4% according to Airbus. This will make it the fifth or sixth most important market in the world by 2018. Other fast–emerging markets are Intra–South America (see pages 7–9), and between Asia and Europe/North America.
Overall, the two RPK growth forecasts are remarkably consistent. Boeing estimates average annual RPK growth of 4.7% over 1999–2018, and Airbus has a rate of 4.6%. Here at least the two jet manufacturers are in agreement — after all, a global growth rate of around 5% p.a. is a tenet of faith in this industry.
| Fleet | Deliveries | Retirements | Fleet | |
| 1998- | ||||
| Single-aisle | 1998 | 2018 | 1998-2018 | 2018 |
| 50-106 seats | 1,231 | 4,116 | 437 | 4,910 |
| (F28/70/100; BAC1-11 | ||||
| BAe 146/RJ70/85/100; | ||||
| DC-9-10; 717-200; | ||||
| Canadair RJ/BRJX; | ||||
| Emb 135/145/170/190; | ||||
| Fairchild 528/728/928) | ||||
| 107-120 seats | 2,258 | 1,326 | 1,400 | 2,184 |
| (737-1/2/5/600; DC-9 | ||||
| MD-87; Caravelle; | ||||
| Concorde, A318) | ||||
| 121-170 seats | 4,446 | 6,450 | 1,490 | 9,406 |
| (737-3/4/7/800; 720; A319 | ||||
| MD-81/82/83/88; 727-200; | ||||
| A320; Trident-3; Mercure; | ||||
| MD-90; DC-8-10/20) | ||||
| 171-240 seats | 1,295 | 2,912 | 453 | 3,754 |
| (737-900; 757; A321 | ||||
| 707-300B/C; DC-8-3/4/5/6/70) | ||||
| Intermediate twin-aisle | ||||
| 230-310 seats | 1,292 | 2,090 | 73 | 3,309 |
| (767; A300; A310; A330-200) | ||||
| 311-399 seats | 1,035 | 2,323 | 173 | 3,185 |
| (777-2/300; A330-300; | ||||
| A340; L-1011; DC-10; MD-11) | ||||
| Large | 1,021 | 933 | 280 | 1,674 |
| (747; 747X; A3XX) | 12,578 | 20,150 | 4,306 | 28,422 |
| TOTAL FLEET | ||||
| Fleet | Deliveries Replace- | Fleet | |||
| 1998- | ments | ||||
| 1998 | 2018 | 1998-2018 | 2018 | ||
| Avro 70 | 17 | 0 | 17 | 0 | |
| F28 | 113 | 0 | 113 | 0 | |
| F70 | 36 | 0 | 26 | 10 | |
| RJ700 | 0 | 25 | 0 | 25 | |
| Tu-134 | 3 | 0 | 3 | 0 | |
| Other 70-seaters | 0 | 385 | 0 | 385 | |
| Avro 85 | 54 | 18 | 31 | 41 | |
| BAC1-11 | 11 | 0 | 11 | 0 | |
| DC-9 | 52 | 0 | 52 | 0 | |
| Other 85-seaters | 0 | 379 | 0 | 379 | |
| 717 | 0 | 115 | 0 | 115 | |
| 737-100 | 4 | 0 | 4 | 0 | |
| Avro 100 | 45 | 13 | 23 | 35 | |
| BAe 146 | 122 | 0 | 122 | 0 | |
| Concorde | 13 | 0 | 0 | 13 | |
| DC-9-30 | 385 | 0 | 385 | 0 | |
| DC-9-40 | 40 | 0 | 40 | 0 | |
| F-100 | 237 | 0 | 221 | 16 | |
| Other 100-seaters | 0 | 1,136 | 0 | 1,136 | |
| 737-200 | 663 | 0 | 663 | 0 | |
| 737-300 | 996 | 21 | 869 | 148 | |
| 737-500 | 373 | 2 | 287 | 88 | |
| 737-600 | 8 | 125 | 0 | 133 | |
| A319-100 | 117 | 428 | 41 | 504 | |
| DC-9-50 | 94 | 0 | 94 | 0 | |
| MD-80 | 725 | 0 | 723 | 2 | |
| MD-80-83 | 239 | 26 | 224 | 41 | |
| Yak-42 | 8 | 0 | 6 | 2 | |
| Other 125-seaters | 0 | 1,763 | 0 | 1,763 | |
| 707 | 1 | 0 | 1 | 0 | |
| 727 | 594 | 0 | 594 | 0 | |
| 737-400 | 437 | 9 | 407 | 39 | |
| 737-700 | 78 | 310 | 15 | 373 | |
| A320-100 | 23 | 0 | 23 | 0 | |
| A320-200 | 634 | 406 | 536 | 504 | |
| MD-80-88 | 157 | 0 | 147 | 10 | |
| MD-90 | 93 | 16 | 57 | 52 | |
| Tu-154 | 45 | 0 | 45 | 0 | |
| Other 150-seaters | 0 | 2,475 | 0 | 2,475 | |
| 737-800 | 55 | 429 | 12 | 472 | |
| 737-900 | 0 | 40 | 0 | 40 | |
| 757-200 | 720 | 111 | 603 | 228 | |
| 757-300 | 0 | 17 | 0 | 17 | |
| A321-100 | 80 | 35 | 68 | 47 | |
| A321-200 | 29 | 106 | 10 | 125 | |
| IL-62 | 8 | 0 | 5 | 3 | |
| Other 175-seaters | 0 | 2,050 | 0 | 2,050 | |