The retirement factor
January 2000


Whether or not airlines exercise restraint with their schedules, the supply and demand balance in the aircraft market looks increasingly precarious.
According to ACAS, there will be about 1,000 jet deliveries to North American, European and Asian airlines in 2000, representing over 9% of the end–1999 fleet (see table below). For narrowbodies the maximum theoretical fleet growth is over 10%, for widebodies 6.5%.
The imbalance can be resolved by: increasing schedules, which will certainly damage yields and load factor; parking aircraft, which is already happening and indicates that a correction in values and lease rates is close; or by increased scrapping and production cut–backs.
The good news is that retirements may actually increase as airlines strive to meet Stage 3/Chapter 3 noise rules and as large numbers of very old aircraft reach the end of their useful economic lives.
According to ESG Aviation Services, some 2,940 aircraft in the world fleet at the end of 1998 were still non–Chapter 3 compliant, and of those 2,250 were at least 25 years old.
ESG forecasts an average of 319 retirements a year in 1999–2004, while Boeing’s estimate is 267. These predictions compare with an annual average of 174 retirements over the past five years and a peak of 268 in 1998.
Just two problems here. First, many of those retirements may not materialise, as predicting them is notoriously difficult. All forecasters in the past have regularly overestimated the number of retirements, as operators like Northwest have profitably stretched the lives of older assets.
Second, even if all those aircraft are retired (say, if the price of fuel spikes up), that is not likely to be enough to avoid excess capacity.
This concern was expressed by ESG’s Ed Greenslet at a December conference in New York.
He estimated that 30% of future orders will be for replacement purposes (up from 20% in the past) and warned that "depending on retirements to maintain a comfortable supply/demand balance in aircraft capacity is a very risky proposition".
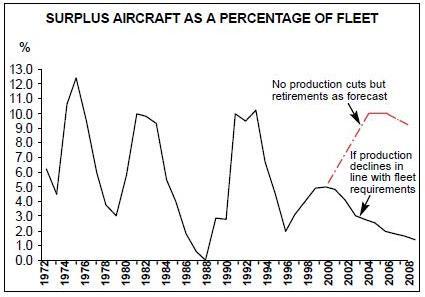
In the rosiest scenario, aircraft production would decline in line with fleet requirements, resulting in a reasonably balanced market with "less fearsome" surplus aircraft peaks than in the past three cycles.
If retirements take place as forecast and there are no production cuts, the peak would be at least as bad as those seen in the past. In the horror scenario, the combined effect of no production cuts and fewer retirements could mean extremely difficult conditions in the used aircraft market.
| Narrowbodies | Widebodies | Total | |||||||||
|---|---|---|---|---|---|---|---|---|---|---|---|
| Ch 2 | Ch 3 | Total | Ch 2 | Ch 3 | Total | Ch 2 | Ch 3 | Total | |||
| N America | 717 | 3,612 | 4,329 | 65 | 807 | 872 | 782 | 4,419 | 5,201 | ||
| Europe | 237 | 2,314 | 2,551 | 35 | 768 | 803 | 272 | 3,082 | 3,354 | ||
| Asia/Pacific | 169 | 909 | 1,078 | 42 | 1,020 | 1,062 | 211 | 1,929 | 2,140 | ||
| TOTAL | 1,123 | 6,835 | 7,958 | 12 | 2,595 | 2,737 | 1,265 | 9,430 | 10,694 | ||
| PLANNED DELIVERIES IN 2000 | |||||||||||
| N America | 477 | 73 | 550 | ||||||||
| Europe | 289 | 48 | 337 | ||||||||
| Asia/Pacific | 56 | 56 | 112 | ||||||||
| TOTAL | 822 | 177 | 999 | ||||||||
| DELIVERIES AS % OF FLEET | |||||||||||
| N America | 11.0% | 8.4% | 10.6% | ||||||||
| Europe | 11.3% | 6.0% | 10.0% | ||||||||
| Asia/Pacific | 5.2% | 5.3% | 5.2% | ||||||||
| TOTAL | 10.3% | 6.5% | 9.3% | ||||||||