Smooth descent from the industry zenith
January 1999


The zenith of the earning cycle in the US industry looks as if it was reached in 1998, but the descent in 1999 will be smooth.
Since the end of 1992 the US Majors have reported improved earnings every single quarter until the third quarter of 1998, and even then the marginal decline was caused by the Northwest strike. The basic formula for success was very simple: restrain capacity growth at 1–3% while demand was running at 4–5% pa, and watch load factors and unit revenues increase.
In 1999, however, there will be a significant capacity surge as deliveries start to accelerate at the same time, inevitably, as demand conditions weaken. Even so the supply/demand balance will not be too badly affected. Various estimates put ASM growth at 4–5.5% in 1999 while RPM growth will be around 3–4%.
The US Majors enjoy an element of flexibility in their fleet planning at present as they can bring forward the retirement of their Stage 2 aircraft. This is the strategy now being employed by American, United and Delta, which are removing their 727s and DC–9s, while Northwest is at least temporarily cutting capacity by parking some 747s that otherwise would be used on the Pacific. There is a limit to this strategy though, as airline have made important investments in hush–kitting Stage 2 types.
In October 1998 unit revenues fell by 3.1%, the first decline in over a year, reflecting a growing resistance on the part of business travellers to high fares. But on the cost side, the airlines have benefited from collapsing fuel prices, which in December were 30% lower than a year ago.
Wall Street overreacted to the first sign of supply/ demand imbalance by dumping airline stocks in the late summer. To some extent analysts have regained confidence in the sector: the First Call analysis of all the analysts’ forecasts, made in December 1998, mostly shows just a moderate decline in 1999 earning per share, and some stocks — Northwest, US Airways and Southwest — are expected to gain value.
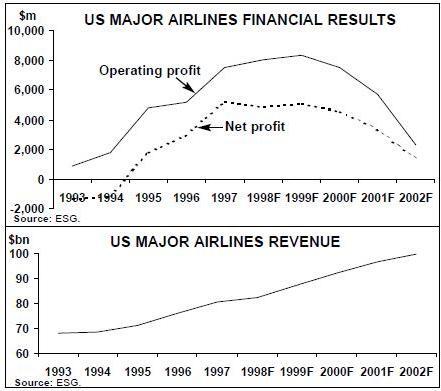
The guru of US airline forecasting, Ed Greenslet of ESG, foresees a marginal increase in profits in 1999 — to $8.3bn from $8.1bn at the operating level and to $5.1bn from $4.9bn for net results. The US Majors' operating profit margin in the 1990s is peaking at 9.5%, in contrast to the previous peak in 1989 when it was a miserable 3.7% of revenue. The implication, as Greenslet points out, is that it would take a recession of early 1990s proportions plus a full–scale Gulf war to wipe out the accumulated industry profits. And that surely can’t happen.
| A300 | A310 | A319 | A320 | A321 | A330 | A330 | A340 | A340 | A340 | A340 | ||
| -600R | -300 | TBA | -200 | TBA | -300 | -500 | -600 | |||||
| European airlines | ||||||||||||
| Aer Lingus | 1 | |||||||||||
| Air France | 15 | 3 | ||||||||||
| British Airways | 39 | 20 | ||||||||||
| CityBird | 2 | |||||||||||
| Corsair | 2 | |||||||||||
| Edelweiss Air | 3 | |||||||||||
| Eurowings | 1 | |||||||||||
| Iberia | 33 | 19 | 6 | |||||||||
| Lufthansa | 6 | 1 | 10 | 10 | ||||||||
| Sabena | 26 | 5 | 3 | 2 | ||||||||
| Swissair | 9 | |||||||||||
| THY | 2 | |||||||||||
| Virgin Atlantic | 2 | |||||||||||
| European total | 220 | |||||||||||
| North American airlines | ||||||||||||
| Air Canada | 2 | 3 | ||||||||||
| United AL | 20 | 32 | ||||||||||
| UPS | 30 | |||||||||||
| US Airways | 7 | |||||||||||
| North American total | 94 | |||||||||||
| Asian airlines | ||||||||||||
| Air Lanka | 6 | |||||||||||
| Asian total | 6 | |||||||||||
| Latin American airlines | ||||||||||||
| LanChile | 11 | 9 | ||||||||||
| TACA | 21 | 11 | ||||||||||
| TAM | 25 | 13 | ||||||||||
| Latin American total | 90 | |||||||||||
| African & Middle Eastern airlines | ||||||||||||
| Emirates | 1 | 6 | ||||||||||
| Nouvelair | 1 | |||||||||||
| AME total | 8 | |||||||||||
| Lessors | ||||||||||||
| debis | 2 | |||||||||||
| GECAS | 2 | 21 | 17 | |||||||||
| ILFC | 6 | 10 | ||||||||||
| SALE | 4 | |||||||||||
| Lessors total | 62 | |||||||||||
| All undisclosed orders | 13 | 6 | 3 | 5 | 27 | |||||||
| TOTAL ORDERS | 32 | 0 | 175 | 164 | 51 | 16 | 8 | 13 | 18 | 8 | 22 | 507 |