Southwest: Eggs
in the one basket problem
Jan/Feb 2020

Southwest is universally acknowledged as the prototype for LCCs throughout the world. It is a very robust prototype, having just produced its 47th straight year of profitability, but the MAX is proving to be a big problem.
A central tenet of Southwest’s operating model has been adherence to a single aircraft type, bringing economies in terms of crewing, training and maintenance, simplifying scheduling and route development decisions, and obtaining very favourable pricing and conditions from the manufacturer in return for exclusivity.
Southwest’s intimate relationship with Boeing dates back to 1971 when the then CEO Lamar Muse (the originator of the Southwest model; the much more famous Herb Kelleher was the company lawyer at the time and didn’t take over the CEO role until 1981) struck a deal for three 737-200 white-tails, a deal he negotiated from the Long Beach office of McDonnell Douglas which thought that it was selling the start-up airline some DC-9s. The terms of the Boeing purchase: $4m per aircraft, no deposit, $50,000 per month for 60 months, interest rate at 1.5% over prime, balloon payment after five years.
Forward 50 years and Southwest has a fleet of almost 750 737s, 164m passengers/year, a stockmarket value of $26bn, and the MAX problem. As CEO Gary Kelly nicely put it at the 2019 Results Presentation in January: “This sort of illustrates the risk of having all your eggs in one basket”.
MAXed out
At the time of grounding, March 2019, Southwest was operating 34 MAXes, which have since been parked in California and which will have to go through a maintenance and make-ready process before they can be flown again. Southwest also has 27 MAX 8s and 7s which have been completed but not delivered by Boeing. With crews available these units could be fairly rapidly returned to service at a rate of 5-10 per week, once the aircraft is recertified. As simulator training is now a requirement to ensure safe operating under MCAS, Southwest is in the process of doubling its MAX sims to six.
According to Southwest’s summary of its contract with Boeing, 2020 deliveries should total 78. This is made up of the 27 aircraft held by Boeing at Renton plus another 35 scheduled 2020 deliveries plus 16 units that under the contract should be provided on operating leases from third parties to compensate for 737-700 retirals that were scheduled to take place in 2019/20 but which Southwest could not implement because of shortage of capacity.
The 2020 figure of 78 deliveries is clearly theoretical. Southwest had been planning on a June resumption of MAX service but in late January Boeing “surprised” the airline by predicting July ungrounding date. Southwest is now planning for just 27 deliveries from Boeing this year which, when added to 34 units that are currently parked under Southwest’s operating licence, would imply an end-year MAX fleet of 61, whereas this time last year Southwest was planning on a fleet of about 112 by end 2020. There is, of course, no guarantee that the 61 figure will be met: the ungrounding decision is in the hands of the increasingly stressed FAA.
All the other MAX operators are, or should be, closely watching what happens at Southwest, not just because of the size of its MAX orderbook (other carriers have larger commitments) but also because of its critical importance to Boeing. Southwest’s compensation terms could act as a benchmark for the other airlines.
Towards the end of last year Southwest reached a confidential agreement with Boeing on 2019 financial damages, structured as a reduction in the prices paid for the delivered owned fleet and the scheduled deliveries. The amount does not show up in the P&L account but a line item in the cashflow account shows cash-in of exactly $400m under “supplier proceeds”, presumably is Boeing’s first payment to Southwest which the airline will use to reduce capex on its orders.
A strong indication of the unit pricing for its MAX 8s was given by the CFO, Tammy Romo, who stated that the 27 MAX 8s scheduled for delivery this year would entail capex of $1.4-1.5bn, net of or about $53.7m per unit, net of supplier proceeds, which is half the list price of $106.1m. She also confirmed that no Pre-Delivery Payments have been made since last March.
However, the $400m figure is less than half the loss Southwest attributed to the MAX grounding in 2019: $828m or 28% of the actual operating profit of $2.96bn. There are several element to Southwest’s calculation of this loss: having to use older types instead of MAXes (which have a fuel consumption advantage of 14% over the NGs) caused a reduction of 1% fall in ASMs/gallon against a planned improvement of 2-3%; ex-fuel CASM increased by 7.7% in 2019 largely due to the fact that total ASMs fell by 1.6% while the cost structure was in place for a planned 7% rise in capacity; unexpected maintenance charges on 737NGs that should have been retired also added to the cost. Unit revenue, RASM, was up 3.7% in 2019, but the company did not attribute any of this increase to capacity squeezes caused by the MAX grounding.
In addition to the direct costs Gary Kelly has highlighted major concerns about how Southwest is being outpaced by competitors which are unaffected by the MAX problem, losing 7-8m passengers to other carriers because of lack of flying capacity, and has said that this element will be brought into the next round of compensation negotiations.
So the 2020 compensation agreement is likely to exceed that for 2019, bringing Boeing’s total payment to Southwest probably to over $1bn, more if there are further delays and complications. But there is a limit to how much Southwest — and the 50 or so other operators of the MAX plus another 30 orderers which have not yet taken delivery of any aircraft (that includes Ryanair) — can extract from Boeing in its current financial state.
By the end of 2019 Boeing’s negative net asset value on its balance sheet had deteriorated to $-8.3bn. (As an interesting comparison, Southwest’s net asset value on its 2019 balance sheet was $9.8bn). Boeing is in the process of raising $10-12bn in debt and looks very likely that it will achieve that, but what is alarming is how fast it has burnt through cash, before paying out for the MAX crash victims (although insurers will cover most of that) and, much more significantly in financial terms, compensating the MAX airline operators and lessors. It may also face cancellations without penalties from some airlines which ordered MAXes speculatively — Norwegian seems to be hinting at that.
Looking at Boeing’s recently published cashflow account, which in the current crisis is more insightful than the P&L: in 2019 the manufacturer increased its net debt by $13bn, of which it used $7.3bn to pay out dividends and buy back shares (despite reporting a net loss); another $3.9bn was needed to cover operating and free cashflow shortfalls; and only $1.8bn was added to reserves. Its cash reserves stood at just $9.6bn at the end of last year, which is lower than the average end-year balance for the pre-crisis 2012-18 period.
It should be noted that Southwest remains optimistic about the future of the MAX aircraft, convinced that there is nothing fundamentally wrong with the design. Its $695m profit sharing pay-out to employees included an additional $125m as an “advance” on the profit levels expected with the MAX returned to service.
Results and investors
Despite the MAX problem, Southwest improved its total revenue between 2018 and 2019, from $18.76bn to $22.3bn although EBIT was down from $3.21 bn to $2.96bn. Its net profit dipped from $2.46bn to $2.30bn, which represents a margin of 10.3%. So Southwest still outperformed the Network carriers on the net margin measure. Delta produced an 8.8% net margin in 2019, United, 6.1%, and American, 3.1%.
As for the stockmarket, price trend comparisons between Southwest and the Networks have to interpreted carefully. The graph shows the four major carriers starting out at roughly the same point in January 2016 but, whereas Southwest was a mature established business with an exceptionally long profit history, the three Networks were recovery stories, having been close to insolvent, then gone through radical restructurings under Chapter 11 bankruptcy protection and intense consolidation through mergers. Nevertheless, Southwest’s share price has tracked very closely the performance of Delta, the most successful of the Networks and has eclipsed its Texan rival, American. United, on this measure, has been the best performer.
Perhaps more significant is this table which updates our analysis of the major investment funds’ holding in the major US carriers. The five institutional cross-holders, those funds that have investments in all four major airlines, now clearly favour Southwest. Holdings by the investor group comprising PrimeCap, Berkshire Hathaway, Vanguard, State Street and Black Rock now account for about 57% of Southwest’s capitalisation against 37% for the four airlines in total. When we first looked at this crossholding phenomenon at the end of 2016, the top seven funds (as there were then) were invested in 38% of Southwest and 32% of the airlines in total.
Southwest compared to the Networks
One of the arguments advanced for allowing the mass consolidation of the US industry was that Southwest would impose competitive discipline on the merged Legacy or Network carriers, that they would in effect be forced to improve their efficiency to something like Southwest’s level. To illustrate comparison between the Southwest and the three main Networks, the graphs trace the key metrics; the data comes from Form 41 and refers to US domestic only, so eliminating most of the distortion from stage length and international network differences, and the period, 2016-18 postdates the integration of the Majors through mergers and predates the MAX crisis.
Enhanced by its genuinely friendly service ethos, Southwest’s product is superior to the Economy offering of the three Networks (and obviously the ULCCs’), and this is reflected in the yield trends (graph). Despite not having a business cabin, Southwest’s average passenger yields have been almost identical to those of American and to the average of the three Networks.
Southwest’s fare policy is very different to that of the European LCCs. There are three tiers:
- “Wanna Get Away”, advance purchase fares at the lowest price, non-refundable but payments may sometimes be transferred to future purchases.
- “Anytime” fares, fully refundable if cancelled.
- “Business Select” fares include priority boarding for the first 15 passengers enabling them to nab the best seats.
All three tiers allow passengers to collect points under the Rapid Rewards FFP. There are no fees for cabin bags nor the first two checked bags.
Perhaps surprisingly, Southwest’s load factors are below or the same as the Networks’ (and not in the 90%-plus range that is the European LCC norm). As Southwest doesn’t rely on ancillaries (or doesn’t hit its customers with unexpected fees), its total unit revenues, in terms of cents per ASM, work out about 14% below the Networks’ average.
Its unit costs, on the other hand, have been consistently below the Networks and have remained stable whereas the Networks’ have escalated. By 2018 the difference in terms of cents per domestic ASM between Southwest and the Networks was 18%. Consequently, Southwest’s domestic operating margin in 2018 was 50% above the average of the Networks.
Point-to-point plus
Southwest has adhered to its point-to-point network model throughout its evolution, characterised by using secondary airports wherever possible, rapid aircraft turns of 20 minutes or so, and intensely rapid build-up of frequencies once it starts up a route. It is now the largest domestic airline, by passengers enplaned, with a 22% share of the US domestic market, and is the market leader in 24 metro areas.
The point-to-point model achieves economies through efficient rostering of flying and ground crew, and through superior aircraft utilisation — Southwest generally gets 1-2 hours more flying per aircraft per day out of its 737s over the narrowbody fleets of the Networks.
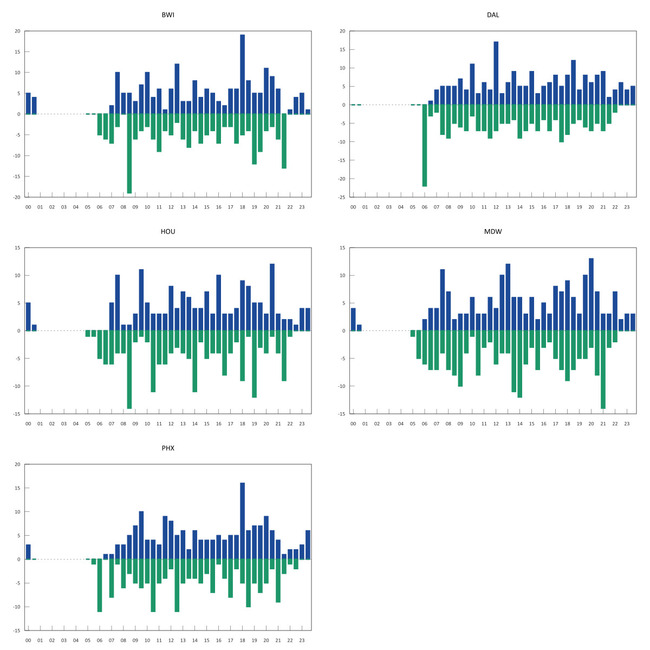
Yet a significant portion of its traffic, 23%, is connecting. This is particularly the case at its centrally located airports — notably Chicago Midway and Denver. Southwest manages to capture these traffic flows without compromising its operating model. Whereas Network carriers design waves of flights arriving and departing within narrow time periods, with inactivity in between, Southwest schedules for maximum aircraft utilisation, with the passenger self-connecting. This usually means a longer wait at the terminal for the connection, and baggage has to be collected and re-checked, but Southwest’s passengers appear happy with the trade-off, and the process is made easier by the fact that its gates are usually conveniently positioned together. The graphs illustrate Southwest’s maximum airport utilisation throughout the day, reflecting maximum aircraft utilisation.
Expansion and speculation
Southwest’s business model depends, in normal times, on growth in capacity of around 5% pa or more, although US equity analysts tend to get panicky about anything over 2-3% which they regard as excessive.
The MAX was intended to accelerate Southwest’s expansion into the Caribbean and Latin America (which account for only about 3.5% of its total ASMs). In the event Southwest’s only major expansion in 2019 was to Hawaii from California and within the islands.
The Hawaii expansion has been “phenomenal” according Thomas Nealon, Southwest President, and has supported the airlines strong California business (it has about 65% of the intra-California market). In typical Southwest fashion it has gone from nothing to 14 dailies from four cities — Oakland, San Jose, Sacramento and San Diego — plus 38 dailies between the Hawaiian islands in a period of 10 months.
Southwest needs to be sure of having the aircraft capacity available to replicate these Hawaiian-type surges (as this market accounts for only 2% of Southwest’s total network). In this regard, Gary Kelly has stated several times that management are reviewing the risk/reward balance of relying in a single-type fleet. But the practical issues are that Airbus would be unable to provide the delivery slots Southwest would require, pricing might not be as advantageous as at Boeing, and new training and recruitment programmes would have to be agreed with the unions.
The alternative would be a take-over. Total speculation at present but JetBlue is the closest to Southwest in terms of operating model and product, is an Airbus operator and currently has 79 A321 neos and 70 A220s on order. Or Southwest could look at a ULCC, having had the experience of fairly successfully integrating Airtran which it purchased in 2010. This time the target would be a Airbus-operating ULCC, maybe Frontier, based at Denver, which as 95 A320neos and 85 A321neos on order or Florida-based Spirit with 145 A320 family neos on order. Southwest has itself expressed worries about the incursion of ULCC s into its markets, so a take-over might address two problems. As for the US DoT and DoJ, it would surely be difficult for these authorities to block such a development, given their approval for all the Legacy mergers.
| $bn | American | Delta | Southwest | United | Total 4 Airlines |
|---|---|---|---|---|---|
| PRIMECAP Management Co. | 1.96 | 1.65 | 3.89 | 3.30 | 10.80 |
| Berkshire Hathaway | 1.25 | 4.15 | 2.90 | 1.93 | 10.23 |
| The Vanguard Group, Inc. | 1.22 | 2.67 | 1.90 | 1.78 | 7.56 |
| SSgA Funds Management, Inc. | 0.39 | 1.17 | 2.14 | 0.71 | 4.41 |
| BlackRock Fund Advisors | 0.53 | 1.42 | 1.09 | 0.98 | 4.01 |
| TOTAL 5 CROSS-INVESTORS | 5.35 | 11.05 | 11.92 | 8.69 | 37.01 |
| % Market cap | 44.7% | 28.5% | 56.5% | 31.3% | 37.1% |
| Other top investors | 1.34 | 3.02 | 2.02 | 4.28 | 10.67 |
| % Market cap | 11.2% | 7.8% | 9.6% | 15.4% | 10.7% |
| All other investors | 5.28 | 24.75 | 7.15 | 14.79 | 51.96 |
| % Market cap | 44.1% | 63.7% | 33.9% | 53.3% | 52.1% |
| Market capitalisation (Jan 22) | 11.97 | 38.83 | 21.09 | 27.76 | 99.63 |
| Market cap Nov 2016 | 24.10 | 36.70 | 23.75 | 29.40 | 113.95 |
| MAX 7 | MAX 8 | MAX 8 | MAX 8 | TOTAL | |
|---|---|---|---|---|---|
| FIRM | FIRM | OPTIONS | ADDITIONAL | MAXES | |
| 2019 Contractual Deliveries | 7 | 20 | 13 | 40† | |
| 2020 Contractual Deliveries | 35 | 3 | 38 | ||
| 2020 TOTAL | 7 | 55 | 0 | 16 | 78‡ |
| 2021 | 45 | 45 | |||
| 2022 | 27 | 14 | 41 | ||
| 2023 | 12 | 22 | 23 | 57 | |
| 2024 | 11 | 30 | 23 | 64 | |
| 2025 | 40 | 36 | 76 | ||
| 2026 | 19 | 19 | |||
| TOTAL | 30 | 219 | 115 | 16 | 380 |
Notes: †27 MAXes parked. ‡16 MAXes Required to be leased in to replace 16 737-300 retirements
Source: anna.aero

Source: DoT Form 41.
Notes: Data refer to US domestic operations