Norwegian: LHLCC finances stressed
Jan/Feb 2018

Norwegian has achieved a small but significant share of the transatlantic market, 3-4% in seat capacity terms, and is expanding rapidly, but it has not yet demonstrated the financial viability of its long haul low cost carrier (LHLCC) model.
Norwegian’s positive news was that passenger volume was up 13% to 33.3m in 2017 while load factor remained roughly the same at 87.5%.
But its fourth quarter financials were disturbing.
Revenues in Q4 2017 were up 30% on the same period in 2016 to NOK7.84bn ($1.0bn), but operating losses of NOK1.03bn were recorded, in contrast to a positive EBIT of NOK335m in Q4 2016. The fourth quarter is normally the poorest performing period of the year, but the extent of the losses was unexpected, and as a consequence the full year results were negative, whereas most of the other European airlines have been reporting improved profitability. CEO Bjørn Kjos stated phlegmatically: “We are not at all satisfied with the 2017 results”.
For the full year, revenues were up 19% at NOK30.94bn ($3.96bn), EBIT was a loss of NOK2.0bn, and the net loss was NOK299m. However, the net loss figure was only arrived at after a tax credit of NOK768m and NOK1.69bn proceeds from its sale of 3.6% of its previous 20% holding in Norwegian Finans bank (NOFI).
Management attribute the 2017 outcome to fuel and growing pains. Capacity, mostly on long-haul, was boosted by 25% last year, which, unsurprisingly, resulted in a 6% decrease in passenger unit revenue (per ASK). Improved ancillaries and other income brought the overall unit cost decrease down to 4.5%.
Despite the capacity expansion, and an increase in average sector length by 9% to 1,607km, no scale economies were achieved; on the contrary, operating unit costs rose by 8% in 2017, while ex-fuel unit costs were up by 6%.
Problematic cost areas included: Personnel unit costs rose by 7% (unadjusted for currency effects), the result of a labour force increase of 37% to 9,400 by year-end, which Norwegian explained as being partly attributable to the need to ramp up pilot crews to cope with peak demand. The related category of flight operation, covering training, crew expenses and insurance, increased by 12% on a unit cost basis. Unit maintenance costs were up by 16%, the result of changes in the fleet through the net addition of nine 787s and six 737MAXes, plus escalation of engine service charges.
Expansion is planned to continue apace this year — a further 40% increase in ASKs and the addition of another 11 787s and 14 737MAXes and -800s. In contrast to 2017 Norwegian anticipates a strong beneficial impact from scale — the company’s headline guidance is for a 12% decrease in cash unit costs (ex-fuel and depreciation) and a 9% decrease ex-fuel. Apart from “scale” there is little visibility on how this turn-around will be achieved (we also had some difficulty in precisely reconciling Norwegian’s own numbers with the predicted decreases).
No prediction on the revenue side has been made by management for 2018, though the implication is that the decline in unit revenues will be less than the decrease in unit costs, and the airline will return to profit. Equity market analysts are less confident: HSBC forecasts a loss of NOK225m at EBIT level and a loss of NOK767m at the net level, reflecting increased finance costs.
This will place further stress on Norwegian’s balance sheet. At the end of last year total liabilities amounted to NOK41.6bn and shareholders funds only NOK4.1bn — a debt/equity ration of 9/1. Moreover, the narrow equity base could be halved if the Norwegian Financial Supervisory Authority (Finanstilsynet, or FT) rules on whether Norwegian’s stake in NOFI should be treated as a financial investment, as it currently is, or as an associated company on an equity basis; in the latter case, the balance sheet value of NOFI would be reduced by NOK2bn.
Then there is the impact of IFRS 16 in January 2019, which will oblige airlines to treat operating leases and finance lease in the same manner, in the process bringing about NOK48bn of lease obligations onto Norwegian’s balance sheet as debt (though the asset values of the aircraft will also be added to the balance sheet).
This capitalisation, despite a relatively good current cash position, looks incompatible with planned fleet expansion — gross capex commitment for this year and next is $4.5bn or NOK12.3bn — and unless profitability is turned around rapidly and significantly, it is unclear as to how Norwegian can continue in its current form. There have been suggestions by the company that Norwegian could be split into an aircraft leasing company and an airline operating company, which does not really address the fundamental issue: which is, Norwegian appears to need new equity.
The largest shareholder in Norwegian is HBK (the investment vehicle owned by Bjørn Kjos and others) with 27%: then Folketrygdfondet, the manager of the state pension fund, 6%; 18 Scandinavian investment funds and banks, 32% in total. Whether they would be willing or able to inject new funds is unknown. Also unknown is whether leading European LCCs would consider an acquisition: very probably not at present, for financial, strategic and aeropolitical reasons (Brexit again, the uncertain status of the UK-US bilateral). But Ryanair and easyJet are interested observers of Norwegian’s situation.
Second generation LHLCCs?
Norwegian’s operating model has many innovative features and has been based on detailed research into the market, but it might come to be regarded as the first generation LHLCC. The historical parallel would be the early 2000s in Europe when second generation LCCs, Ryanair and easyJet, improved the models developed by the likes of Air Europe. They eventually thoroughly disrupted the intra-European market and distressed the incumbent flag-carriers.
What elements might make a second generation LHLCC a true disrupter of the network carriers — ultimately taking 30-40% of the market, maintaining unit costs and fares below network carrier levels and achieving 20% profit margins? Here are some thoughts on the possible second generation.
- Network and bases
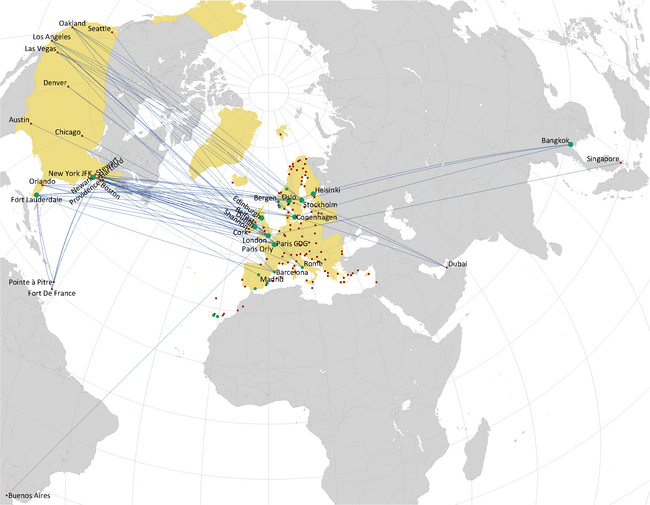
The map shows Norwegian’s now extensive Atlantic network with flights being operating from just about everywhere in Western Europe — Oslo, Copenhagen, Stockholm, Dublin, Amsterdam, Madrid, etc. The network, Norwegian suggests, is complete as three quarters of capacity expansion will be generated through ramping up schedules.
But what is missing is a large-scale symbiotic relationship with a major base airport, preferably in London. This has been, for example, a key element in Ryanair’s strategy — negotiating discounted rates in return for guaranteed volume growth, most notably at its main base, London Stansted. It is conceivable that a typical Ryanair agreement applied to the Atlantic would result in passenger charges of less than 25% of those in force at Heathrow and less than 50% of those applicable at Gatwick. Stansted has an incentive to enter into a growth/discounted price contract as its capacity, soon to be 36m pax/year, substantially exceeds throughput of 26m; Gatwick, on the other hand, is at its limit and so has little incentive for such a contract.
LHLCCs clearly cannot be pure point-to-point operators; they also need feed. Norwegian has been actively pursuing transfer traffic to feed its long-haul operations but this requires scale at the connecting bases, which it does not have. Also, it has not progressed much with interline agreements with other LCCs. The idea of a large scale intraline operation at Stansted connecting short- and long-haul traffic might give the Legacies palpitations.
- Product
Norwegian is increasing its Premium cabin on its new 787s. This is a recognition that that filling Premium as well as Economy cabins is vital for an LHLCC on the Atlantic. Without this income stream, it is impossible for the operation to achieve decent returns.
This is undoubtedly a challenge — no one as yet has achieved the right combination of Premium seats allocation, ratio of Premium to Economy fares and product — but business travel is price-sensitive, and there are important passenger segments that LHLCCs can appeal to by offering fares at say 25% of the published tariff of the Legacies. Business travellers from SMEs without access to the corporate rates (maybe half the published prices) negotiated by conglomerates and banks are a target for LHLCCs. Corporate travel departments will soon catch on to the potential cost savings.
It is almost a given that the legacies will respond to LHLCCs by matching seating density in Economy and by duplicating their short-haul Economy product on long haul — basically this means paying for food and drinks. Making onboard service a profit centre rather than cost has been an integral part of the LCC model, but when a Legacy adopts this policy, consumers’ perception hardens, they understand than they are buying a commodity, and price becomes all-important for Economy travel.
- Labour costs and Overheads
This is the segment of the cost pie where LHLCCs should have an unbridgeable advantage over the Legacies.
Despite the fracas over unionisation at Ryanair, the LCC model, short or long, does not necessarily mean low cockpit pay but it does require efficiency. Cockpit crewing levels are necessarily higher on a long-haul operation — say, 7.5 crews per aircraft, compared to 4.5 for a short-haul LCC operation. The problem for the Legacies is that they have a multiple of these ratios.
Lean management really means lean at genuine LCCs. For example, Ryanair with a fleet of about 400 aircraft, employs just 112 managers and 485 administrators. Then there is the looming question of unfunded pension liabilities, a big problem at Legacies but not an issue at LCCs. Further major costs savings come from a clean IT set-up as opposed to adding onto Legacy systems and from inexpensive buildings.
The problem is sustaining this cost advantage over time, and Norwegian’s 2017 results tend to show a vulnerability to cost escalation.
Total employees per aircraft is a crude but sometimes useful indicator. Ryanair provides the exacting LCC benchmark of about 30, for its all 737 fleet. For the Legacies the ratio of employees per aircraft is well over 100 for total operations, short and long-haul. Norwegian, which is still predominantly a short-haul operator, now has 65 per aircraft.
- Fleet costs
Norwegian will have achieved a good discount from list prices on its 787 and 737MAX orders, how much exactly is a guess — 35%?
What would be really disrupting would be an LHLCC obtaining 50-60% discounts from a manufacturer as the result of a severe recession, or managing to pick up a distressed 787 fleet sale. Ryanair and easyJet locked in an unmatchable and long-term cost advantage when they placed mega-orders for 737s and A319s in the wake of 9/11. Such a severe downturn is unpredictable, but if or when it does happen then the Legacies would again be left very exposed to low cost new entrants. Ryanair has specifically stated that it is only likely to enter long-haul when it can do an aircraft purchase deal at deeply discounted prices, bulk purchasing, including future contract prices, as it did so successfully in 2002.
| US$m | Norwegian | Ryanair |
|---|---|---|
| Revenues | 3,957 | 8,673 |
| EBIT | -255 | 2,113 |
| EBIT Margin | -6.4% | 24.4% |
| PBT | -136 | 1,808 |
| Net Debt/ Total Assets | 95.0% | 5.3% |
| ROIC | 1.1% | 26.0% |
| Shareholders Funds (BS) | 521 | 5,440 |
| Stockmarket Value | 660 | 23,200 |
Norwegian: FY to Dec 2017 Ryanair: FY to March 2018 (est). Ratios sourced from HSBC