Jetstar:
the future of Qantas?
Jan/Feb 2016

The Jetstar group of LCCs posted impressive results in the last financial year and it’s now a key part of Qantas’s brand strategy, both in Asian domestic and long-haul markets. With Jetstar’s long-haul fleet now comprising 787s, how important will the LCC be to the Qantas group’s international expansion over the next few years?
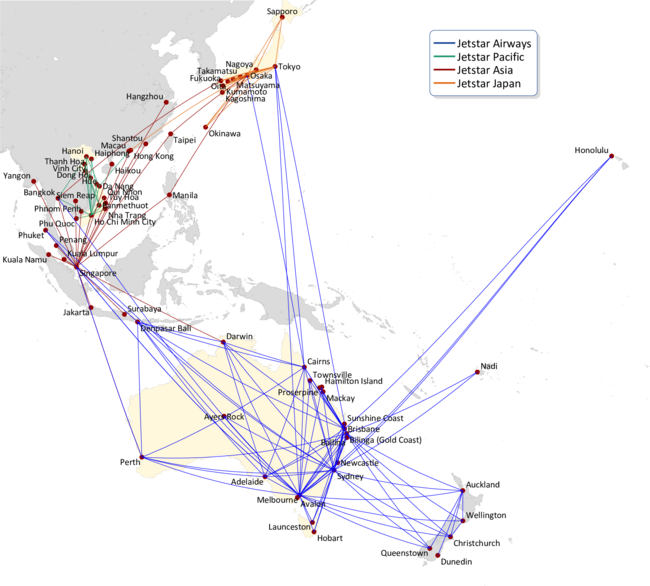
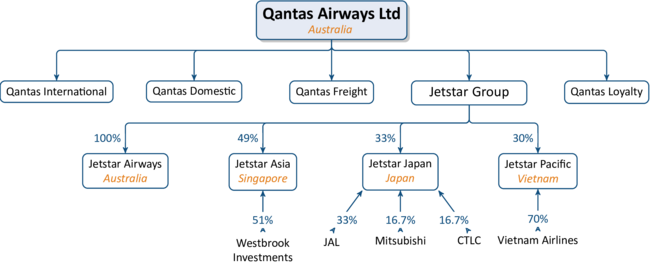
The Jetstar group of LCCs currently consists of four airlines — Melbourne-based Jetstar Airways, Singapore’s Jetstar Asia Airways, Vietnam-based Jetstar Pacific Airlines, and Jetstar Japan. All of them are well-established; Jetstar is the largest low-cost airline in Australia/New Zealand and Japan, and the second-largest in Vietnam and Singapore.
The first carrier with the Jetstar brand was Jetstar Airways, which was launched as a low cost subsidiary of Qantas in 2003. Today it operates 71 aircraft, comprising 53 A320s, six A321s, 11 787-8s and a single Dash 8. The fleet has an average age of six years and operates to 19 domestic destinations and 14 internationally, in New Zealand, Japan, Singapore, China, Thailand, Indonesia, Fiji and the US. In its 2014/15 financial year (the 12 months ending June 30th 2015), Jetstar Airways carried 17.9m passengers, 4.3% up on the previous 12-month period.
Jetstar Japan is based at Narita and was launched in 2012 as a joint venture between Qantas and JAL, who each have a 47.5% “economic interest” in the carrier, though formally the equity is split 33.3% each for Qantas and JAL (as this is the limit for foreign ownership in Japanese airlines), with Mitsubishi Corporation owning 16.7% and Century Tokyo Leasing Corporation another 16.7%. It operates to 11 domestic destinations and just two international ones — Hong Kong and Taipei (both started in the second half of 2015) — with 20 A320s that have an average age of just three years.
Jetstar Asia Airways was launched in 2004 before merging with rival Valuair in 2005. It operates 18 A320s (with an average age of six years) on 26 routes to 12 destinations throughout Asia. Via a holding group called Newstar Holdings, Qantas owns 49% of the airline with 51% belonging to Westbrook Investments, a company that is controlled by Singaporean businessman Dennis Choo, who also owns a major Singaporean travel agency. In the 2014/15 financial year the airline carried 4m passengers — actually a drop of 9,000 compared with 2013/14. But average stage length rose during the year and ASKs increased by 6.8%, with load factor rising to 77.8% in FY 14/15.
Based in Ho Chi Minh City, Jetstar Pacific Airlines was formed in 1991 as Pacific Airlines, a cargo operator that was the first Vietnamese carrier to have a foreign investor. In the years after launch it had a colourful history, including nationalisation, before Qantas acquired an 18% stake in 2007, which has since risen to 30% (with the rest held by Vietnam Airlines). The airline changed its name to Jetstar in 2008 and today operates 10 A320s and two A321s (with an average age of nine years) to 17 destinations domestically and in China, Hong Kong, Thailand, Macau and Taiwan.
Altogether Jetstar’s fleet currently stands at 121 aircraft, including 101 A320s, eight A321s, 11 787-8s and a single Dash-8. In terms of expansion, in August 2011 the Qantas group placed an order for 110 A320s (comprising 78 A320neos and 32 classic A320s), which according to Qantas “Jetstar has access to in order to facilitate its growth”. The first aircraft will arrive in the second half of 2016.
A turnaround
In FY 14/15 (ending June 30th), the Jetstar Group reported revenue of A$3.5bn (€2.4bn), 7.5% up on FY 13/14 and based on a 3.3% rise in passengers carried to 21.8m, a 3.7% rise in Group ASKs and an increase in load factor from 77.9% to 79.9%. In the July 2014 to June 2015 period the Jetstar Group posted an underlying EBIT of A$230m (€160m), significantly better than the A$116m loss it posted in the previous financial year.
Qantas says the turnaround was due to:
- A 2% reduction in “controllable” unit cost at the overall Group level (chiefly excluding fuel and forex).
- Growth in yield on domestic Australian routes, thanks to better brand co-ordination with Qantas Domestic in what the group calls “stabilised market conditions”.
- New Zealand domestic routes breaking through into profitability.
- A turnaround at the Singaporean operation that improved its EBIT year-on-year substantially and broke into the black.
- The 787s driving better performance (both in terms of units cost and appeal to customers) at long-haul routes out of Australia’s Jetstar.
- Jetstar Pacific reporting a profit at the EBIT level in the second half of the financial year.
- Jetstar Japan “significantly improving” its unit revenue and cost position, helping it to reduce losses.
This recovery continued in the first half of FY 2016. For the six months ended December 2015 revenues were up by 8% to A$1.9bn with a 4% growth in capacity, 7% increase in demand and a 2 point increase in load factor to 82.2%. Unit revenues on domestic Australian routes were up by 10% year on year compounding the benefit from the falling fuel price; and the group generated a record underlying operating profit of A$262m up from A$81m in the prior year period — a margin of nearly 14% — despite an estimated A$23m impact from Indonesian volcanic eruptions. Even Jetstar Japan was profitable for the first time.
At the core of the turnaround is Jetstar’s implementation of a so-called ‘Lowest seat cost’ programme, part of a bigger cost-cutting effort called “Qantas Transformation”. For example, the Jetstar operation in Australia has reduced its controllable unit costs at a CAGR of more than 2% since FY 07/08, and this trend is likely to continue thanks to the transition of the long-haul fleet to 787s (completed in September 2015). The first of the model arrived in November 2013 (making Jetstar the first Asian LCC to operate 787s) and they have replaced ageing A330s that were sent back to parent Qantas.
The 787s have 335 seats, are configured with two cabins (economy and business) and have transformed the economics on Jetstar’s international routes. In addition, on short-haul A320neos will be introduced to Jetstar Airways from 2017, which will achieve a 15% reduction in average fuel consumption compared with the classic A320s.
Jetstar’s focus in the current financial year is specific to each of the four airlines, but for the biggest carrier — Australia’s Jetstar Airways — one goal is better utilisation of A320s on domestic routes, where Qantas believes its Jetstar subsidiary has already built a substantial network advantage over other domestic Australian LCCs (in particular, Tigerair Australia) based on higher frequencies in every domestic airport it operates at. For long-haul, the aim is to strengthen its brand in key markets (thanks to the new 787s), and more tightly integrate its strategy with that of its parent Qantas.
Long-haul strategy
Qantas has been restructuring its own problematic long-haul operation for a while, partly by closing loss-making routes (such as Sydney to Frankfurt) and postponing or cancelling aircraft orders. These long-haul changes have been part of a fundamental restructuring of the company under Qantas CEO Alan Joyce (appointed to the position in 2008; he had previously been CEO of Jetstar Airways since 2003) that took six years to complete — with international being a particular focus over the last three years.
In the 2014/15 financial year Qantas International realised “more than A$400m of transformation benefits”, says the company, also thanks partly to better aircraft utilisation and new pay and conditions with long-haul pilots that has deliver productivity gains of around 30%. There is even evidence that Qantas may have gone too far in trimming its long-haul operation. Last summer — just a few months after completing a 5,000 reduction in its workforce — Qantas had to offer crews working on its international flights incentives to work on their days off following a shortage of staff for new long-haul routes.
Nevertheless, Qantas’s international operations recorded underlying EBIT of A$267m in FY 14/15, compared with a A$497m loss in FY 13/14 — which was its first profit since 2008. However, part of the reason for was this was the significant fall in fuel prices as well as a lessening of competition on long-haul routes to and from Australia, the latter due partly to the weakening Australian economy and Dollar. As Joyce puts it, “the international environment that we have now is very different from the environment that we had two, three years ago. We are not going to be seeing the sort of situation we’ve had where we’ve got [up to] 10% capacity growth into the international market, and the currency is one of the big drivers of that — Australia is much less attractive place for foreign carriers to put aircraft”.
Meanwhile this recovery also continued into the current financial year. For the six months to December 2015 revenues at QF International were up by 7.5% to A$2.95bn with capacity growth of 6.5% and an improvement in load factors of 1 point to 83.3%. Underlying operating profits more than trebled to A$270m.
Looking forward, Qantas’s plans for long-haul are based partly around the replacement of its 747-400 fleet with 787-9s, of which it has eight on order. They will start arriving at Qantas International from the end of 2017, and a fleet of 45 is possible in the long-term if it exercises all its options and purchase rights.
In the short-term the majority of international expansion will be through the adding of new frequencies to existing destinations, and while there will be new routes that expansion will be selective. In the current year it is reallocating aircraft "in response to shifting demand": broadening its US network through its alliance with American on the Pacific (and re-opening a route to SFO last December), while putting additional services into Asia (particularly Japan, Hong Kong, Singapore and Manila).
However once the 787-9s arrive this will allow Qantas International to expand on longer, thinner routes, with the smaller, more efficient aircraft enabling profitability on routes to destinations that it has previously tried and failed to make profitable in the past — such as to Beijing. But Qantas is also eyeing new routes into US and Europe, and Joyce has cited Melbourne-Dallas (a great circle distance of 14,500km) as an example of a route where a 787-9 service could make economic sense.
Jetstar’s role
Clearly Jetstar is an important part of Qantas’s overall portfolio strategy, and what Qantas calls “dual brand co-ordination” has already “unlocked significant value”. In Australia, the future is about building higher frequencies on long-haul destinations and leveraging the brand both ways — ie marketing campaigns that encourage even traffic flows on Jetstar routes, rather than relying on Australian travellers.
There clearly will also be international growth (and China is one market that Jetstar will increase routes to), but given Qantas International’s plans for expansion once the 787-9s arrive, it’s probable that the significant difference in the relative growth rates between Jetstar Airways and Qantas International seen up until now will reduce.
Over the last few years (other than FY 13/14) Jetstar Airways’ international capacity has grown much faster than Qantas’s international ASKs (see chart). As a result — and as can be seen in the chart — Qantas’s share of the international market to/from Australia has fallen substantially in the last nine years, while Jetstar’s share has remained stable. So while Jetstar’s domestic passengers total in Australia is significantly lower than the passengers carried by Qantas domestically in 14/15 (12.9m versus 21.5m) — its international total of 5m to/from Australia is not far off Qantas’s international passengers carried of 5.8m.
But Qantas International’s market share is likely to rise in the future once the 787-9 expansion occurs, and so while Jetstar will also grow internationally, it will be on carefully targeted sectors.
Outside Australia, the strategy for Jetstar is to build strong “independent” airlines in partnership with local shareholders in key Asia/Pacific markets and with low levels of capex coming from Qantas. Markets defined as key are those that have high GDP per capita or high growth — and with low to medium LCC penetration. That definition clearly excludes Thailand, Malaysia, Indonesia and the Philippines (where AirAsia is dominant) but does include (other than the markets Jetstar is already in) countries such as China, Hong Kong, South Korea and Taiwan.
Qantas has long wanted to launch a Jetstar airline in Hong Kong, but efforts to gain an AOC that began back in 2012 have been thwarted at every turn, largely due to fierce objections by incumbent airlines Cathay Pacific, Dragonair, Hong Kong Airlines and Hong Kong Express. In June 2015 the latest attempt — made in partnership with China Eastern and a local investor — was turned down by the regulatory authorities, and in August Qantas said it was abandoning its attempt to launch Jetstar in Hong Kong, writing off the fledgling Jetstar Hong Kong business in its FY14/15 accounts at a cost of A$21m (€15m).
With China tricky politically, South Korea and Taiwan are likely to be the focus of any attempt to launch a new subsidiary in the short-term, though Qantas believes there is still plenty of room for expansion at its existing Asian ventures.
Qantas wants to increase the fleet at the Vietnamese subsidiary, Jetstar Pacific Airlines, to 30 aircraft by 2020, but the market with the greatest potential appears to be Japan. While Qantas says Jetstar Japan has around a 60% share of the domestic Japanese LCC market, intense competition with other LCCs (which include Peach Aviation and Skymark Airlines) and a relatively high-cost environment has meant that Jetstar Japan has struggled to break even. Jetstar Japan is reducing its losses, and the goal is to take an even firmer grip on the LCC market by increasing its fleet to 50 in the long-term. Joyce says that the LCC share of the total Japanese market is just 8%, so “this is a fantastic business in a market with significant future growth opportunities”.
The dual brand strategy
Qantas is unique in having successfully created a low cost subsidiary (originally perhaps as a union-bashing exercise) seemingly in direct competition with the legacy full service brand. However, the two brands are being increasingly closely coordinated with "dynamic management of capacity to optimise ... in a shifting demand environment". Even the Jetstar Group’s Asian subsidiaries are pursuing a similar close coordination with the legacy partners in each respective country. And this certainly seems to have worked to generate superior returns in the current year.
For the six months to December the group announced a doubling in underlying operating profits to A$1bn and pretax profits of A$0.9bn up from A$367m in the prior year period. As a consequence it reported an RoIC on a twelve-month rolling basis of a stomping 22.8% (compared with its target through the cycle of 10%) and announced a A$500m share buy back.
In the short term the group is emphasising that the Qantas and Jetstar brands provide product segmentation and superior margins: Qantas as a full service carrier concentrating on the high yield business oriented markets, maintaining network, frequency and product for a premium customer base; Jetstar with a leading low fares position in domestic and outbound Australian market and a strengthening panAsian portfolio.
In the longer run, it may be questioned whether they really need the two separate brands, whether the future of Qantas is in fact Jetstar.
| Qantas | Jetstar Group | Orders | |||||||
| Qantas | QantasLink | Jetstar | Jetstar Asia | Jetstar Japan | Jetstar Pacific | Total | 2016-2020 | 2021-2026 | |
| 717 | 18 | 18 | |||||||
| 737-800 | 67 | 67 | |||||||
| 747-400 | 13 | 13 | |||||||
| 787 | 11 | 11 | 8 | ||||||
| A320 | 53 | 18 | 20 | 10 | 101 | 31 | 70 | ||
| A321 | 6 | 2 | 8 | ||||||
| A330 | 28 | 28 | |||||||
| A380 | 12 | 12 | 8 | ||||||
| Total | 120 | 18 | 70 | 18 | 20 | 12 | 258 | 39 | 78 |
TO/FROM AUSTRALIA