Southwest Airlines: Return to growth mode
Jan/Feb 2011

After a modest two–year contraction, Southwest Airlines, the largest US carrier in terms of domestic passengers, is looking to take advantage of significant new revenue and growth opportunities in 2011 and 2012. When will the low–cost pioneer attain its profit and ROIC targets and resume fleet growth?
Southwest, which turns 40 this year, has gone through quite a transformation in the last few years and is now clearly on the verge of another important phase in its development. It was indicative that the airline chose New York as the venue for its annual investor day on December 16 (the event is usually held in Dallas).
The previous time the investor day was held in New York, in 2007, Southwest had outlined what it felt was a three–year strategic plan. The aim was to boost revenues by $1bn annually, to compensate for a substantial hike in costs resulting from the waning of the carrier’s advantageous fuel hedges (which saved it $4.5bn in 2000–2008). However, the oil price surge in 2008 and the subsequent economic recession meant that Southwest ended up doing much more in terms of revenue–building and restructuring.
Southwest’s management came to New York, first of all, to present their analysis of how the airline performed against the 2007 plan and how it weathered the 2008–2009 industry challenges. Second, the management wanted to explain in depth what Southwest intends to accomplish in the next 3–5 years as part of its new strategic plan for 2011–2015.
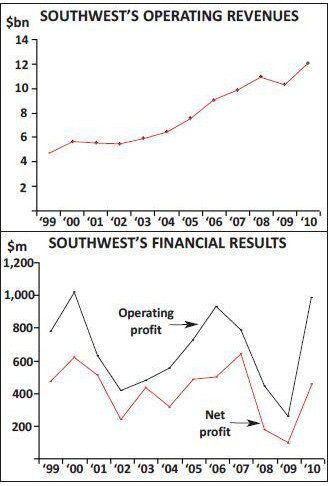
The results of the three–year postmortem are pretty impressive. Southwest has boosted its annual revenues by more than $2bn — double the target set in 2007. It has outperformed the industry in RASM and almost closed the load factor gap with the legacies. It has grown its market share, improved its customer experience, kept its culture intact, remained profitable and preserved its strong balance sheet. Its cumulative earnings have grown by 87% since 2007. 2010 was Southwest’s 38th consecutive profitable year, when it achieved a highly respectable 10% ROIC and a 10% operating margin. The only negative development has been that Southwest has lost some of its cost advantage.
In other words, Southwest has once again proved its ability to successfully manage change and weather a recession. It has emerged from the toughest couple of years in aviation history looking very strong.
Southwest is enjoying great momentum as it prepares to tackle four demanding strategic projects in the next few years. Most importantly, there will be the AirTran acquisition, which Southwest hopes to close in the June quarter.
Second, Southwest will be adding the larger 737–800 to its fleet from March 2012. To start with, the airline has substituted 20 of its 737–700 orders for the -800s.
Third, Southwest will be rolling out a new FFP this March. The programme should make it more attractive to business travellers in long–haul markets and potentially contribute “several hundred million dollars a year” in extra revenue.
Fourth, Southwest is looking to implement a new reservations platform “sometime after 2012”. This will give it the capabilities to add international destinations, along with other customer service and revenue enhancements.
Southwest hopes that these and other projects will help it attain its 15% ROIC and other financial targets by 2012, which would enable it to resume fleet growth. The projects will certainly mean many exciting network expansion opportunities. BofA Merrill Lynch analyst Glenn Engel suggested in a January 20 research note that Southwest has the “brightest organic growth outlook in years”. Engel noted in particular the following opportunities:
- New opportunities in the Southeast, particularly the Atlanta business markets, through the AirTran acquisition;
- Caribbean routes brought by AirTran, which should boost the attractiveness of Southwest’s network in the eastern US;
- Potential to serve many new long–haul destinations, including Hawaii, with the longer–range, ETOPS certified 737–800s;
- Attractive longer–term growth opportunities from Southwest’s Dallas home base, facilitated by the full expiration of the Wright Amendment in 2014, coupled with a new terminal at Dallas Fort Worth (the Wright Amendment prohibits nonstop longhaul service from Dallas Love Field, though it was partially relaxed in 2006);
- Immediate access to Newark, a primary hub for business traffic, thanks to the recent award of 36 slots (as part of United Continental’s merger–related slot divestitures).
Southwest continues to confound critics who argue that its domestic growth opportunities are very limited. It is adding three new cities to its network in March (Newark, Charleston and Greenville–Spartanburg) and has further growth planned from Newark and Denver this summer.
It will be interesting to see if the emergence of multiple promising growth opportunities will start helping Southwest’s share price, which, despite the carrier’s success, has gone nowhere in the last decade. The price is currently in the same $11–12 range it was in early 2000. One of the key reasons has been Southwest’s focus on the mature domestic market, which has created a perception that it lacks growth opportunities.
Stifel Nicolaus analyst Hunter Keay expressed it as follows in a recent Bloomberg TV interview: “Southwest is probably the closest we have in the airline industry to a real business. They deliver steady ROIC. They make money consistently. They own a bunch of their planes. Their debt burden is very limited. But the growth catalysts that they have are, let’s just say, not very sexy compared to some of the other international airlines.”
How to weather a recession
Southwest has proved many times in the past that it can prosper in any kind of environment. Its business model is very recession resistant, always coming into its own in hard times. However, the LCC model in general is not well suited to a high oil–price environment, because LCCs carry more price sensitive leisure traffic and because fuel constitutes a larger percentage of their total costs. Southwest was fortunate that when oil prices surged in 2008, it was already focused on the waning fuel hedges issue and well on its way to adjusting to what it saw as permanently higher cost levels. Also, some of its new revenue initiatives were already producing dividends. In many respects, when the recession hit the industry, the efforts to adjust the business model merely had to be moved into higher gear.
What exactly did Southwest do to cope with the 2008–2009 challenges? First of all, it stopped growing. The plan had been to grow ASMs by 5–6% each year in 2008–2010; instead, ASMs rose by only 3.6% in 2008, declined by 5.1% in 2009 and remained flat in 2010. By deferring deliveries and accelerating retirements, Southwest was able to end 2010 with 54 fewer aircraft than projected in 2007 (546, rather than 600).
Second, Southwest made further network adjustments. Its December 2010 schedule consisted of 8% fewer flights than its summer 2007 schedule. It pulled back in less profitable markets and redeployed capacity to open a number of new cities (Minneapolis, LaGuardia, Boston, Milwaukee, Panama City) and to grow aggressively in key markets such as Denver. This “schedule optimisation” strategy enhanced the profitability of the network and maintained employee morale.
Third, Southwest reduced capital spending. In June 2007 it had anticipated spending $1.3bn in 2008 and $1.5bn in 2009, but cumulative capex in those years was cut by $1.3bn. Last year’s capex was only $493m and this year’s is expected to be $800–900m.
Fourth, Southwest took advantage of competitors’ unbundling by adopting and heavily advertising a “Bags Fly Free” policy. Many in the financial community argued that the airline was just leaving large amounts of money on the table, but Southwest saw it as a “strategic opportunity”. It built a brand promise out of “Bags Fly Free” and believes that the strategy has been instrumental in helping it gain market share.
Fifth, Southwest deferred work on its “International Connect” project (code–sharing with Mexico’s Volaris) in favour of accelerating to 2009 other initiatives that would bring in revenues much faster. Those initiatives included “Early Bird”, “Pet Fares” and Unaccompanied Minors’ charges, which were basically instant contributors to the bottom line. (The Volaris code–shares were finally launched in November 2010.)
Southwest was encouraged by the success of its early revenue initiatives, which included a new “Business Select” product and a new boarding method, both introduced in late 2007. In addition to generating ancillary revenues, Southwest sought to improve its customer experience and go past the “one size fits all” approach it had used in the past, in particular to appeal even more to the business customer (these strategies were discussed in detail in the Jan/Feb 2008 and April 2009 issues of Aviation Strategy.)
In the past three years, Southwest also continued its intense technology development drive — necessary to support the new activities. Work on upgrading e–ticketing, front–line point–of–sales and revenue accounting systems was completed in 2009, and an enhanced website was launched last year.
In short, Southwest had a great, flexible plan and implemented it well. As a result, despite the recession, it grew its annual revenues by $2.2bn or 23% between 2007 and 2010. Its RASM rose by 24%. In the same period, capacity was down by 1.6%. Of the $2.2bn increase in revenues, around half came from improved yields, one third from carrying more passengers (higher load factors) and the rest from Business Select and other new revenue initiatives.
In each quarter in the past three years, Southwest outperformed the industry in terms of domestic PRASM. It has also almost closed its historical load factor gap with the legacies. Its load factor improved from 72.6% in 2007 to 79.3% last year, when ATA carriers’ average domestic load factor remained at the 83–84% level. Point–to point carriers typically have lower load factors, but the schedule optimisation efforts and strong growth in connecting traffic in the past five years (to 40% of the total) have enabled Southwest to raise its load factors.
Southwest has also grown its market share in the past five years. Its O&D passenger share of the US domestic market rose from 16.8% in 2Q05 to 21% in 2Q10. The next largest in 2Q10 was Delta (19.5%), which Southwest overtook in 2007.
The market share shifts have obviously been the strongest in the new cities that Southwest has entered. At Denver, the airline built a 26% market share (equalling United’s 27% share) in just four years, with much of the gain coming from United. In the Boston area, Southwest is now the largest carrier with a 17.7% share, up 13–14 points in the past five years. At Chicago, Southwest’s share is up by 6–7 points to 25.5%, to virtually equal American’s and United’s 26–27% shares.
Southwest’s latest biannual “brand survey” indicated that it continues to “gain significant strength in our brand health across a range of metrics”. The “brand commitment” findings were particularly gratifying: 58% of the respondents said that they would go out of their way to fly Southwest, up from 42% in 2006. Much of the increase was accounted for by business travellers.
Although Southwest has obviously not achieved all the financial goals set in 2007, its performance has nevertheless been impressive. In 2010, despite a $350m negative impact from fuel hedges, it staged a very strong earnings recovery, posting ex–item operating and net profits of $1.2bn and $550m respectively. The ex–item operating margin was 9.9%, up from 5.2% in 2009. The goal (in 2007 and today) is to grow its annual earnings by 15%. Southwest earned a 10% pretax ROIC for 2010, which was short of the 15% goal laid in 2007 but represented significant progress. The airline hopes to achieve the 15% goal in 2012.
But Southwest has managed to protect its capital structure, maintain lease–adjusted leverage at around 40%, maintain strong liquidity and preserve its investment–grade credit rating by all three main agencies. At the end of January, it had an ample $3.9bn in cash, plus a fully available $600m credit facility and unencumbered aircraft worth in excess of $7bn.
Southwest has not succeeded in controlling non–fuel unit costs as well as it would have liked. BofA Merrill Lynch’s Engel calculated recently that the 14% increase in its non–fuel CASM in the past two years was 10 points higher than the industry’s. Lack of ASM growth, wage increases, higher airport fees and lower aircraft utilisation were all to blame. As a result, Southwest’s cost advantage over the legacy carriers has continued to narrow.
The good news is that the cost advantage is still substantial: in Southwest’s estimates, its ex–fuel CASM in 2Q10 was about 35% below the legacy carriers’ stage length–adjusted average. The differential is all the more impressive when considering that Southwest has retained it without pay cuts or furloughs and while continuing to pay industry–leading wages. Furthermore, Southwest’s cost pressures are expected to ease as it resumes ASM growth and adds the larger 737–800s.
The AirTran acquisition
Southwest’s most important strategic project in the 2011–2015 plan period will be the acquisition and integration of AirTran, the eighth largest US carrier. The $1.4bn cash and stock deal (or $3.4bn including AirTran’s net debt and capitalised aircraft leases) is still awaiting regulatory clearances and approval by AirTran shareholders (a meeting has been scheduled for March 23). The deal was covered in detail in the October 2010 issue of Aviation Strategy, but here is a summary and an update.
Southwest wants AirTran for the profitable growth opportunity that it offers. The networks are complementary. AirTran would give Southwest 38 new destinations, including access to Atlanta, the largest US city Southwest does not serve. Further, the airline believes that connecting the two networks will create “hundreds, maybe 1,000” new itineraries that will drive hundreds of millions of dollars in new O&D traffic to boost load factors on existing flights. All that can be done without raising fares or adding aircraft.
The combination would have a 25%-plus share of the US domestic market. The larger network and the addition of Atlanta would enhance Southwest’s ability to attract business traffic.
Southwest expects the acquisition to generate net synergies of “at least $400m” by 2013. Putting that into perspective, to achieve that would require adding just four new passengers per day in each of the 1,000 new connecting markets. By comparison, Southwest averaged 25 connecting passengers per day in its 1,700 connecting markets in 2009.
Southwest believes that it can offset the cost impact from having to bring AirTran’s employees to its higher wage levels. In BofA Merrill Lynch’s estimates, its unit labour costs are more than one cent per mile higher than AirTran’s, but all of its other costs are lower.
AirTran will be operated as a subsidiary for some period of time. The transition to one brand is expected to take 2–3 years. Since its successful Atlanta operation is very different from what Southwest does, connecting the networks there will be a slow process. But to get revenue benefits quickly, Southwest anticipates implementing code–sharing with AirTran soon after the deal closes.
One of the biggest challenges may be technology integration, all the more so because it would have to be done while Southwest is also transitioning to a new FFP and a new reservations platform. But the management is not overly concerned, because (in typical Southwest fashion) they plan to be well prepared and work through it at a reasoned pace.
Revenue and technology projects
The management have also said that they need to be “very humble” about the integration. AirTran is a very successful and profitable airline that does many things differently, and Southwest wants to learn from it. “So, with Atlanta, we need to make sure that we understand how that works before we start tinkering with it”, Southwest’s CEO Gary Kelly said recently. However, certain service aspects, such as “Bags Fly Free” at Atlanta, are probably non–negotiable. This winter is seeing Southwest roll out two new offerings aimed at business travellers. On March 1 the airline will launch an all–new “Rapid Rewards” FFP — the number one improvement its business customers have been asking for. The other new offering is satellite–based WiFi, which has been unveiled on some 50 aircraft and will be available fleet–wide by 2013.
The new FFP, which took many years to develop at a cost of around $100m, addresses the key weaknesses of Southwest’s existing programme. It is dollar–based (rather than trip–based) and allows members to redeem their points for international flights for the first time. It should make Southwest more attractive to business travellers on long–haul routes and make it easier to sell miles to credit card and other partners. CEO Gary Kelly has called the programme Southwest’s single largest opportunity to boost ancillary revenues.
It seems likely that the new FFP and in–flight internet will complete Southwest’s range of special offerings for the business traveller, at least for the time being. Southwest knows its customers, having surveyed them extensively in the past five years. The products introduced so far have vastly improved the customer experience, and the airline is apparently not getting requests for additional things such first class cabins, bigger seats or assigned seating. Rather, in the future Southwest plans to do more to generate non–ticket sales (hotels, car hire, etc) through its website.
On the technology side, the main project will be to replace the aging reservations system, which has served Southwest well for 20 years but does not have the capabilities it now wants in terms of accommodating additional fare rules, facilitating full code–share alliances and enabling it to launch its own international flights. The management indicated recently that they had narrowed the choice to two systems (Amadeus or Sabre) but did not give a timeline for a decision. Implementation will be a multi–year process “sometime after 2012”.
Fleet strategy in transition
The other major strategic project is the introduction of the 737–800. Southwest announced the long–awaited decision after both its pilots’ and flight attendants’ unions had ratified agreements to add the type to their current contracts. In the first place, Southwest substituted 20 of its 737-700 orders for -800s, meaning that all of its 2012 deliveries will be -800s. The airline continues to evaluate and work with Boeing about converting its remaining 71 firm 737–700 orders scheduled for 2013-2016 delivery into -800s.
The 737–800, which has 38 more seats than the -700 and requires a fourth flight attendant, will lower unit operating costs, enhance customer comfort, enable Southwest to boost flying from high–demand, slot–controlled or gate–restricted airports, and open up many potential new long–haul destinations, including near international markets.
Since the aircraft will be ETOPS certified, Hawaii service is a strong possibility. Southwest noted that it is a west–of–the-Mississippi principal leisure market and being able to offer it as a frequent–flyer destination would be highly desirable (in the same way as being able to offer the Caribbean, thanks to AirTran, to east–of–the-Mississippi customers will significantly enhance the appeal of the FFP).
Southwest is very fortunate in that there are no labour issues to complicate matters. The airline will be able to bring in a larger aircraft and fly it at the same pay rates as the 737–700, at a time when the pilots are worried about the issue of seniority integration associated with the AirTran acquisition.
Capacity and fleet growth plans
It looks like Southwest would be stuck with AirTran’s 717–200s (most of which are leased from Boeing Capital), but the airline is happy to operate them if the deal goes through. First, the aircraft are well suited to AirTran’s smaller markets. Second, Southwest believes that a fleet of 86–plus 717s is large enough to allow it to operate that sub–fleet efficiently in its network. Third, Southwest’s management are reconciled to the fact that at some point, when the 737 replacement process gets under way, the airline is going to be operating multiple fleet types for a long period of time anyway. (Boeing is expected to make a decision by mid–2011 on whether to develop an all–new aircraft for 737 replacement or go for an interim step of re–engining the 737. Southwest said that it would then have to evaluate its options.) Southwest is currently looking to grow its ASMs by 5–6% in 2011 (excluding any potential impact from the AirTran acquisition). The schedule optimisation strategy and increased aircraft utilisation will make it possible to launch the three new cities in March with essentially a flat fleet. Although Southwest is taking 19 737–700s this year (including two leased aircraft), there are likely to be double–digit 737–300 retirements.
The airline said on January 20 that it continued to evaluate the 737 classic retirement schedule for 2011 and beyond. Absent AirTran, Southwest currently has no intention to grow the fleet significantly until it reaches its profit and ROIC targets.
In late January the management described the financial outlook for 2011 as “quite good”, except for fuel, of course. Strong revenue trends are expected to continue, with domestic capacity remaining tight and amid concrete signs that business travel is finally recovering in short–haul markets.
Southwest has substantial fuel hedges in place through 2014 that protect against $100–plus oil prices, giving it ample time to adjust. And it has more “revenue offsets” (the FFP and the like) coming up in 2011.
| Firm -700s | Firm -800s | Options | Purchase rights | Used -700s | Total | |
|---|---|---|---|---|---|---|
| 2011 | 17 | 2 | 19 | |||
| 2012 | 20 | 20 | ||||
| 2013 | 19* | 6 | 25 | |||
| 2014 | 21* | 6 | 27 | |||
| 2015 | 14* | 1 | 15 | |||
| 2016 | 17* | 7 | 24 | |||
| 2017 | 17 | 17 | ||||
| 2018-21 | 98 | 98 | ||||
| TOTAL | 88* | 20 | 37 | 98 | 2 | 245 |