Financial recovery - up in the air?
Jan/Feb 2011


This time last year we were looking at the potential of recovery in 2010 in the hope of an emergence from the worst recession for a generation: the IMF was projecting global economic growth of 4% (and 2.5% in the developed world); IATA predicting a 5% increase in airline traffic but worldwide losses of $5.6bn. In the event, the bounce back has as usual (and as expected) been far stronger than anticipated – at least in most areas.
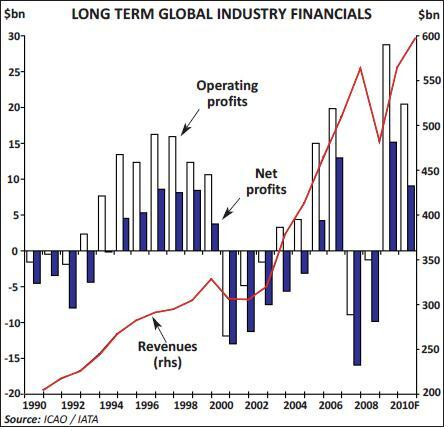
It now looks as if world GDP may have grown by 5% in 2010, with a near 3% growth in the advanced economies; the airline industry has seen total passenger traffic up by some 6% and freight traffic up by 18% and, with continued restraint on capacity (up by a possible 3% overall), been able to achieve significant improvements in yields – almost back to pre–crisis levels; for December 2010, ATA figures suggest that domestic yields had finally risen above the 2008 levels. Of course, these growth figures would have been even higher for the full year had European airspace not been closed for a week following the eruption of Eyjafjallajökull in April last year. IATA is now predicting in its December financial forecast that total airline traffic (in RTK) will have grown by 12% in 2010 (against a 6% growth in capacity) with a 5% hike in overall yields producing an annual growth in revenues of 17% to some $565bn – the same level of global airline revenues achieved in 2008. At the same time it is now expecting operating profits for 2010 of nearly $30bn (a margin of 5.5%, similar to previous peaks of the cycle) and net profits of $15bn.
Although we have seen this strong rebound in 2010, there remain many doubts in the immediate potential for the world’s economies and airlines' fortunes. In many ways the economic recovery has been and remains two–speed. The developing nations have been racing ahead – with both China and India immune from the global recession and registering some 10% GDP growth in 2010. ASEAN and Brazil grew by 7%, and Russia by 4.5%. The IMF continues to project Chinese growth of 9.5% a year for the next two years; and that for India and Brazil of 8% and 4% respectively. Among the developed world the US, Canada, Germany and Japan have not done too badly with growth of 2–4%; but other major developed nations have had very lacklustre performance – with the UK, France and Italy showing growth of only 1% at best.
At the same time the IMF has upgraded its global forecasts marginally for 2011. Citing fiscal packages in the US and Japan, stronger than expected private consumption in Germany, and lauding policy reactions in the Euro–zone in response to the crises in Greece and Ireland, the institution is now looking to a growth in the developed nations of an almost “normal” 2.5% — while emphasising that this is a dismal level of recovery from the recessionary period and hardly sufficient to counter the rise in unemployment resulting from the recession. Equally it notes worrying inflationary pressures not least of all in the developing nations, notably commodity — and especially fuel and food – prices; it envisages further upside risk to basic commodity prices as a consequence of the poor harvests at the end of 2010 let alone the strength of the developing nations' economies. It quotes as a central forecast its assumption of $90/bbl fuel price – while current spot prices once again have exceeded the $110 level.
Meanwhile, it suggests that financial conditions may be expected to improve with a further gradual easing of lending conditions – even though it expects that financial stress will remain elevated in the peripheral Euro–zone where market participants remain concerned about sovereign and banking risk. Of more concern is evidence of early overheating in some economies; rapid growth in emerging and developing economies has narrowed or in some cases closed output gaps, with resultant severe pressures on inflation – with inflation forecasts for these countries averaging 6%. In the developed world in contrast, with continued economic “slack” and “well–anchored” inflation expectations should keep inflation low at around the 1–2% level. This should in all fairness lead to much needed forex balancing – but in the absence of some exchange rate floats could perhaps lead to increased trade tensions.
Aircraft order cycle
As with all economic forecasts the IMF adds caveats. There are downside risks: the pressures in the periphery of Europe could spread back to the centre and dissolve the Euro pact; inflationary pressures on the developing nations could create a traditional boom and bust. On the other hand there may be upside potential; investment within the developed economies could rebound. Reading between the lines the IMF seems to consider that the downside risk may outweigh the upside – with particular concern that financial institutions would tighten credit conditions even further and provide an additional halt to global economic performance. Meanwhile the aircraft order cycle also saw a strong improvement last year. There appear to have been a total 1,600 net new jet orders up from the nadir of 785 in 2009, while new jet aircraft deliveries have been steady at around 1,110 units – or a fairly normal 5% of the fleet. The order backlog meanwhile has expanded to over 8,000 aircraft (exceeding even the 2008 peak) equivalent -- despite recent increases in production rates -- to 7.5 years. Ed Greenslet, in his latest forecast update in January, is suggesting that 2010 saw the peak of aircraft surplus to supply requirements at nearly 14% of the world inventory (its highest ever peak) and that with a forecast of 5.5%-7.5% growth in traffic and capacity over the next few years even the build up in anticipated production and deliveries (perhaps towards 1,500 units a year) over the period will be absorbed allowing the supply/demand balance – at least globally — possibly to continue to improve further.
All other things being equal, a reasonably positive forecast of GDP growth should be reasonably positive for air transport; but the recovery here too may be somewhat two–speed. While traffic performance in the Far East is pulsating, there still appears to be a long way to go before the levels of global premium traffic return to the previous peaks – in the latest figures from IATA for November 2010, the numbers of passengers travelling in the front cabins had shown consistent recovery from the depths of the despair in the first quarter of 2009 following the collapse of Lehman Bros – but in absolute numbers have only just returned to levels seen at the back end of 2004, and still some 15% below the peak.
This represents an opportunity – as long as long–haul capacity growth remains relatively constrained – for continued improvements in yields through the upturn. In addition, on the one side the consolidation in the US domestic market following the mergers of Delta/Northwest and United/Continental, and on the other side the increased effective operational consolidation on the Atlantic (the largest international route area in the world) with three alliance–based ATI joint ventures of oneworld (BA/AA/IB), SkyTeam (AF/KL/DL) and Star (UA/CO/LH et al) effectively controlling two–thirds of capacity, appear to be giving some observers some hope for a rationality in the capacity and pricing environment to hope for sustained improved returns.
Echoing IMF comments, IATA sees the European region as being in the weakest position in the medium term – with some major countries reining back on stimulus packages to implement more austere financial plans — even those who have not been forced to. In addition, the introduction of fairly high air passenger taxes in Germany (and Austria) along with the increases in air passenger duty in the UK, will have a further dampener on demand adding some 3- 5% to air fares as a whole (while looking further out to 2012 there is the spectre of the introduction of the European Emissions Trading Scheme to aviation).
In December IATA was projecting global industry net profits of US$9bn for 2011, (down from the forecast $15bn for 2010) with slippages in margins through all regions; but for European carriers as a whole it expected operating profit margins to come in below 1% of revenues, with substantially all the industry’s net profits to be achieved by North American and Asian carriers. Upsetting all these forecasts however will be the direction of fuel prices and with spot prices currently some 25% above those at the end of last year, the risks could once again be on the downside. We have seen some recovery, but, as usual in this industry, the outlook is as uncertain as ever.
| 2008 | 2009 | 2010 | 2011 | 2012 | ||||||
| GDP | ||||||||||
| World Output | 3.0 | -0.6 | 5.0 | 4.4 | 4.5 | |||||
| Advanced economies | 0.5 | -3.4 | 3.0 | 2.5 | 2.5 | |||||
| United States | 0.4 | -2.6 | 2.8 | 3.0 | 2.7 | |||||
| Euro area | 0.6 | -4.1 | 1.8 | 1.5 | 1.7 | |||||
| Japan | -1.2 | -6.3 | 4.3 | 1.6 | 1.8 | |||||
| United Kingdom | 0.5 | -4.9 | 1.7 | 2.0 | 2.3 | |||||
| Canada | 0.4 | -2.5 | 2.9 | 2.3 | 2.7 | |||||
| Other advanced economies | 1.7 | -1.2 | 5.6 | 3.8 | 3.7 | |||||
| Newly industrialised Asian economies | 1.7 | -0.9 | 8.2 | 4.7 | 4.3 | |||||
| Emerging and developing economies | 6.1 | 2.6 | 7.1 | 6.5 | 6.5 | |||||
| BRIC | ||||||||||
| Russia | 5.6 | -7.9 | 3.7 | 4.5 | 4.4 | |||||
| China | 9.6 | 9.2 | 10.3 | 9.6 | 9.5 | |||||
| India | 7.3 | 5.7 | 9.7 | 8.4 | 8.0 | |||||
| Brazil | 5.1 | -0.6 | 7.5 | 4.5 | 4.1 | |||||
| World trade volume (goods/services) | 2.8 | -10.7 | 12.0 | 7.1 | 6.8 | |||||
