Air cargo industry - leading indicator of recovery?
Jan/Feb 2010

It’s hardly surprising that air cargo is one of the aviation sectors to suffer the most from the global recession, but the actual downturn has almost been cataclysmic — demand fell by an average 15% in RTKs in the year to September 2009, and revenues last year are estimated to have plummeted by 30%, with yields down by 20% (albeit partly affected by reductions in fuel surcharges). When — and how — can the air cargo industry recover from this severe setback?
International freight demand is very closely related to economic activity, and so it is natural to find that when the world economy stops, trade stops and so the economics of running a cargo operation disappear. The fall in demand is clear to see in all the available data — Drewry’s container freight rates index fell by 45% in the first six months of last year while the Baltic Dry index fell by 90% (from its peak of more than 11,000 in 2008). Both of these indices recovered in the second half of 2009, but they remain a long way below their peaks.
Air versus sea
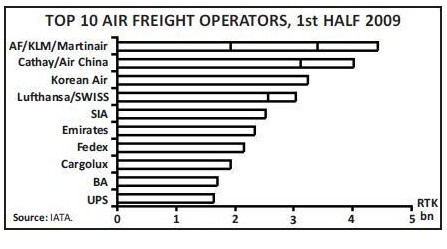
The top 10 carriers account for more than 30% of the air cargo market and they are dominated by European and Asian companies. It may come as a surprise, but following the takeover of the remaining minority in Martinair last year the AF/KLM group is now the largest player, with an estimated 5% share of the market (see chart, below). Cathay/Air China comes a clear second while the only US players to appear in the list are the freight–only operators Fedex and UPS. At the same time the list neglects any mention of the ACMI operators, which provide a significant level of service under others’ flight numbers. Intriguingly, excluding the US express operators (and BA for a different reason) they each have a fleet of 15–20 full freight aircraft — augmented in many cases by combi aircraft (especially at AF/KLM, due to KLM’s fondness for the variant). It is notable that for the top six players’ belly holds in passenger aircraft (and combis) provide the majority of capacity. All these cargo operators have been suffering badly in this recession — with revenues initially down by more than 40% and profits severely reversed — even though freighter aircraft operations tend to be relatively flexible. Overall, the air cargo business is a relatively small but important part of the air transport industry. Although it shows many of the same characteristics as the far larger passenger business, there are some essential differences. There are two ways to transport goods over long distances and between continents — sea and air, but the air cargo industry accounts for a tiny portion of the total volume of this trade. Of the estimated 7.4bn tonnes of goods transported by air and sea in 2007, air transport accounted for a mere 42m tonnes, or 0.5%. Of course air transport provides a significant enough advantage for time sensitive and high value goods sufficient to offset premium pricing (it has been estimated that commodity goods need to be worth more than $16/kg to make it worthwhile to send by air — although it should be emphasised that air freight is more characterised by volume than by weight necessarily). At the peak in 2008, air cargo generated $61bn in revenues (11% of total airline industry revenues), which was estimated to be some 14% of the total air and sea freight market. These revenues have grown by an average annual 7.3% over the previous six years, (incidentally compared with a growth in air passenger revenues of more than 9% a year), somewhat higher than the 5% annual growth in sea cargo over the same period.
Although it is dangerous to generalise, all transport operations involve sending a vehicle from point 'A' to point 'B' and back to point 'A' (even though you may go through the rest of the alphabet in between). The passenger transport business — whether bus, train or plane — has a significant advantage in that the passenger (otherwise known as SLF — or self–loading freight) whom you carry from A to B usually wants to get back home to A some time later. In contrast the cargo market essentially involves mono–directional traffic — i.e. it won’t want to come back. This in turn leads to significant imbalances in trade flows by both volume and, because capacity has to go both ways, by price.
The table below highlights some of the problems. The data is taken from Air France/KLM’s investor day last November, when it tried to explain how its cargo business could recover profitability. As can be seen, the largest single routes by value in 2008 were from Asia to Europe and Asia to North America: each show outbound volumes of 2m tonnes a year generating some €5.6bn in revenues on yields of around €2.8/kg, while inbound traffic was significantly lower at 0.9m and 1.3m tonnes respectively on yields 50% lower. The third major international traffic flow was on the North Atlantic — more evenly matched with 1.4m and 1.3m tonnes respectively, although with a significant difference in yields.
Structural problems
Another problem is the variation in distribution of goods transported on individual trade flows. Products carried are dominated by seven main industries that account for more than 90% of the total: high tech goods provided 23% of the demand weight, capital goods and spare parts some 21%, fashion 14%, pharmaceutical 12%, fresh produce 8%, automotive 7% and mail/express 7%. But there are some major inequalities on individual routes. Outbound traffic from Asia to North America and Europe is heavily dependent on high tech and fashion, which provide 60% of the total business on each sector. Unsurprisingly, outbound traffic from Europe is dominated by capital goods, high tech and pharmaceutical industries. In addition to all this there is no real customer loyalty, to either choice of carrier, value of in–flight service, or hub of departure or arrival — so long as the goods actually get to their final destination roughly on time. The air freight charges may be a small part of the total end value of the goods transported — perhaps 2–3%; if a shipper shaves even a small portion of the small cost of transportation, this will flow straight to the transporter’s bottom line.
The effective customer for air freight carriers is an intermediary and not usually the ultimate producer nor the customer of the goods. This market is dominated by the freight forwarders and shippers, many acting as agents and duty bound under fiduciary rules to find the best underlying contract for their clients. Here, as in many industries, the market is consolidating. In 2004, according to the AF/KLM presentation, the top 10 forwarders (including DGF, DB Schenker, K&N, Nippon, UPS and Panalpina) accounted for 38% of the market. By 2008 this had risen to 48%, with the top three accounting for 27% alone. Although the total market remains fragmented, the larger forwarders seem set to continue to gain market share and have been pursuing external revenue gains, partly through acquisition of smaller companies — with an average annual growth in revenues of some 18% in the five years to 2008. For air cargo operators there is the danger that the forwarders will gain even more control and be able to exercise increasing market power in pricing.
Most goods transported by sea or air do not have the departure or arrival port by that mode of transport as the ultimate origin or final destination. Consequently they usually require some onward trucking as part of the logistics chain; and where there are competing trans–shipment hubs at either end the forwarders and shipping agents will be able to play each transport provider against each other to provide the best value for their clients. In Europe, as an example, traditional intra-European air freight has been in decline (although express services have been growing strongly and account for over half of intra-European air cargo), but many airlines have used trucking (with their own flight numbers) to try to extend their networks to the ultimate consignee; in the five years to 2007 the number of weekly truck–flight frequencies offered by scheduled airlines grew from 3,870 to 11,497 per week, representing an average annual growth rate of 24%. Moreover, the distances between major airports in the core of population distribution in Europe are so relatively small that the choice to a shipper of Frankfurt, Paris, Amsterdam, Zurich or Brussels is almost irrelevant.
Uniquely, perhaps, for the air cargo business there is an inherent problem of oversupply of capacity and effectively a near zero cost of entry into the business. More than half of total air freight capacity is provided by the space in the belly–holds of passenger aircraft — and even though Boeing, in its market outlook, expects this ratio to fall over time it is not by much. The airline industry is one that is fond of marginal pricing — transportation is a very short shelf life product; once the aircraft has taken off you cannot sell a ticket for the empty seat or space in the hold, so it is worthwhile getting almost anything for a bit of capacity that would otherwise fly empty. Many airlines treat cargo as a truly marginal business.
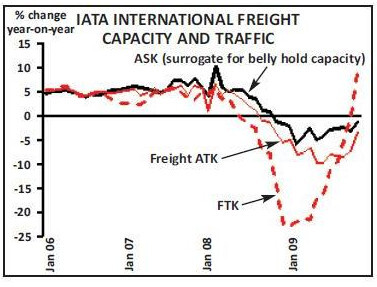
In the final quarter of 2009 various elements pointed to a reasonable hope of recovery, even though it is very uneven. There appears to be a good economic rebound in the Asia/Pacific region and parts of South America, but demand in developed markets remains weak. In November — the first real monthly figures avoiding the direct comparison of the halt in the world economy in the previous year — IATA recorded a 9.5% growth in international freight RTKs (see chart, above), even though the level of business is still more than 5% below the levels of the same month in 2007, and it appears likely that similar strong rates of growth will be registered in coming months. Notably, Lufthansa published some very strong figures for December with a 20% jump in traffic in RTKs and a 10pt improvement in load factor on the back of a slight increase in capacity, while Air France/KLM saw an 8pt improvement in load factor for the month with capacity down by 20% and freight traffic down by 8%.
Demand and yields now appear to be moving in the right direction, although there is still a long way to go before the 2008 peak levels are regained and at least two years of traffic growth and four years of revenue growth have been lost in this exceptional downturn. However, the price increases put in place (totally independently) by Lufthansa and AF/KLM in the final quarter appear to be sticking and other shipping indices are also improving — with the Baltic Dry Index up by 200% and Container rates up by 30%.
Though the air cargo business will surely recover, it won’t escape the underlying issues it faces — an imbalance of trade flows, a concentration of forwarders, low barriers to entry and intense competition.
| Outbound | Inbound | Outbound/Inbound flow mismatch |
||||||||
|---|---|---|---|---|---|---|---|---|---|---|
| Volume | Rates | Revenues | Volume | Rates | Revenues | |||||
| (000t) | €/kg | €m | (000t) | €/kg | €m | Volume | Revenues | |||
| Asia-North America | 2,000 | 2.8 | 5,880 | 900 | 1.4 | 1,260 | 2.2x | 4.7x | ||
| Europe-North America | 1,400 | 2.2 | 3,080 | 1,300 | 1.5 | 1,950 | 1.1x | 1.6x | ||
| Asia-Europe | 2,000 | 2.8 | 5,600 | 1,300 | 1.4 | 1,820 | 1.5x | 3.1x | ||
| Europe-South America | 200 | 2.2 | 440 | 200 | 1.5 | 300 | 1.0x | 1.5x | ||
| Europe-Africa | 300 | 1.9 | 570 | 300 | 1.6 | 480 | 1.0x | 1.2x | ||
| Europe-Middle East | 800 | 1.9 | 1,520 | 600 | 1.6 | 960 | 1.3x | 1.6x | ||