Stockmarket prices: Up, down and sideways
February 2003


In the October issue of Aviation Strategy we took a look at the stock markets’ valuations and reviewed share price performance of the major airlines on both sides of the Atlantic.
At the time we were looking at a position where recent massive weekly falls had put most of the share prices at all time lows. BA saw its share price at a post privatisation historic 17–year low and faced expulsion from the FTSE Index. At those levels, despite the bearish news facing the industry, there was a general gut feeling that share prices could not possibly go lower.
In this issue we revisit the data. Since then there was an improvement in sentiment towards industry — with share prices rebounding some 50%-150% from the lows encountered in October. However, recently it has all been downhill. The world’s stock markets have been increasingly worried since November about the threat of war and terrorism; the global economy; and climbing fuel prices, which tend to have a disproportionate affect on airline stocks. Prices have once again tumbled to close to all–time lows — exacerbated once again by the US quarterly results season.
At any point in time a share price has the potential to rise, fall or stay the same. History does provide a guide — in that in the short run price rises show an excess of buyers over sellers: and conversely otherwise.
What the share price performance over the past two years tells us tell is that there has overwhelmingly been an excess of sellers over buyers; any feeling of cheapness in valuation towards the sector has been shelved; and this even in consideration of the bounce in share prices since October lows.
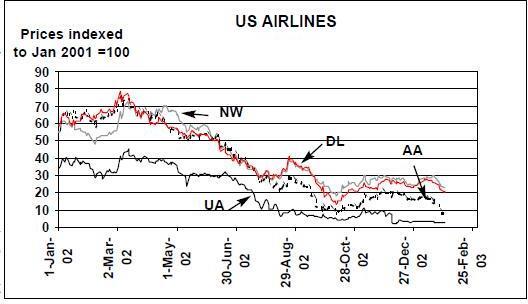
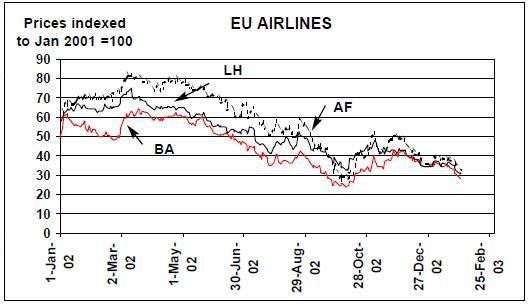
Are we in fact looking at a “dead cat bounce” — the purely technical view of a share price performance based on the cruel idea that dead cats don’t bounce more than once (and only a little bit) when you drop them? The pattern of airline share price performance in the last quarter of 2002 has been wilder in North America than Europe — but dramatically gave investors the opportunity to make and lose significant amounts of money. Ignoring the Chapter 11 cases, United and US Airways, the major network carriers’ share prices jumped by between 70% and 160% from the lows in October. In Europe the similar performance was between 40% and 90%.
Since those highs were achieved, share prices in the US have fallen another 20%- 60% and in Europe by 25–45%.
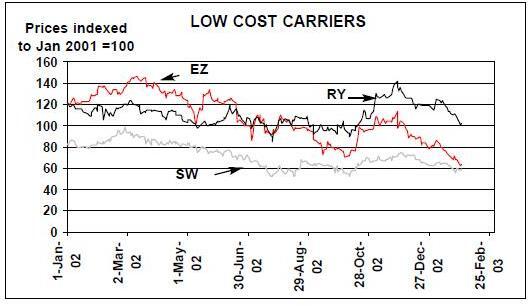
The LCCs live in a different world. Ryanair goes from strength to strength; Southwest — now the only profitable major carrier in the US — holds its own. easyJet is resilient despite fears about its expansion programme and the digestion of Go.
US impact
As at end–January all the non–officially bankrupt US majors had reported their results for the December quarter and full year 2002.
These make depressing reading for all but one. As traditional with bad reporting seasons there appears to have been the tendency to include the kitchen sink and stuff as much bad news as possible into the period.
The quarter was inevitably going to show strong annual improvements for the simple reason the comparison was with the period immediately after the September 11 attacks.
For the quarter the five majors who have reported show traffic up by 13% and capacity up by 6% against the prior year period.
Revenues in the quarter similarly rose by 14%. Net losses fell by 22%. The full year figures show a more dismal picture. Traffic grew by a mere 2% (more than all provided by Southwest) and capacity was static.
Revenues fell for the full year by some 6% (with a whopping 9% fall at American) and the overall net loss widened for these five to $5.8bn. American itself reported a net loss of $3.5bn for the full year all on its own.
However, this did include some $1.5bn of special charges in the year and the underlying net loss came in at "only" $2bn up from a comparable loss of $1.4bn in the prior year.
Wall Street seems to have viewed all of the results so far as "better than expected" — but generally marked the industry down again. However, some elements are very disturbing. The position at American in particular appears dire — see Briefing, pages 6–10.
Moreover, all the majors are going to have to take charges to the balance sheet to cover pension fund shortfalls from current actuarial valuations reflecting lower interest rates and the significant drop in the stock market — and this will be at least $1.1bn for American, $1.6bn for Delta and $1bn for Northwest.
The current gainers are surely Delta, Northwest and Continental — if they manage to get their way in creating the domestic code share agreement that the DOJ has allowed and the DOT does not want.
| Oct 2002 | High since | End January | High | Current | |
|---|---|---|---|---|---|
| Low | Oct | 2003 | compared | price to | |
| with Oct low | recent high | ||||
| Northwest | $5.14 | $8.60 | $6.58 | +67% | -23% |
| United | $1.71 | $4.45 | $1.15 | +160% | -74% |
| American | $3.15 | $8.25 | $3.13 | +162% | -62% |
| Delta | $6.48 | $13.73 | $10.19 | +112% | -26% |
| Continental | $3.65 | $9.85 | $6.80 | +170% | -31% |
| Air France | €7.12 | €13.28 | €8.42 | +87% | -37% |
| Alitalia | €0.21 | €0.31 | €0.24 | +48% | -23% |
| BA | 94p | 167p | 110p | +76% | -34% |
| KLM | €8.10 | €12.90 | €7.40 | +59% | -43% |
| Lufthansa | €8.60 | €12.76 | €8.25 | +48% | -35% |
| SAS | SEK45.5 | SEK62.5 | SEK46.5 | +37% | -26% |
| American | Northwest | Continental | Delta | Southwest | |
|---|---|---|---|---|---|
| Traffic | 15.9% | 16.9% | 8.9% | 15.6% | 2.8% |
| Capacity | 6.2% | 9.2% | 7.4% | 3.3% | 5.2% |
| Load factor (LF) | 69.8% | 74.4% | 70.6% | 71.2% | 63.0% |
| Break Even LF | 87.7% | 90.6% | 79.5% | 79.6% | 61.0% |
| Unit Revenues | 2.6% | 7.5% | 5.7% | 12.2% | 7.5% |
| Unit Costs | -5.3% | -0.6% | -4.1% | -10.9% | 6.3% |
| Revenues | $4,190m | $2,339m | $2,038m | $3,308m | $1,401m |
| % change | 10.1% | 17.8% | 17.3% | 15.5% | 13.2% |
| Op profit (loss) | $(679)m | $(177)m | $(56)m | $(211)m | $88m |
| % change | -35.1% | -43.8% | -79.3% | -64.5% | 136.6% |
| Net Profit (loss) | $(529)m | $(488)m | $(109)m | $(367)m | $42m |
| % change | -33.7% | 125.9% | -26.8% | -50.3% | 66.8% |