Forecast updated, not so bad as before
February 2002

Aviation Strategy has now updated its global traffic and surplus forecast originally made last October.
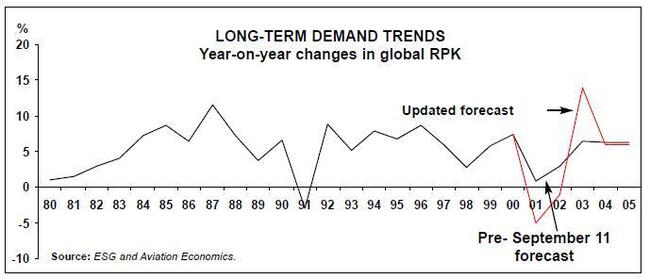
2001 comes in almost as badly as expected with global RPKs down nearly 5%. This is the worst year ever (the decline in Gulf war–impacted 1991 was 3%).
However, traffic has been recovering. AEA international traffic had declined by an average of 16% between September 11 and the end of January, but the latest total for the last week in January shows a fall of 5% (a note of caution: the AEA numbers are now being complicated by the removal of Sabena from the base data, the transfer of Swissair operations to Crossair, and of course do not include the rapidly expanding low cost carriers). ATA reported that US system RPMs fell by 14% in December compared to an average decline of around 25% for the period from September 11 to the end of the year. AAPO estimates that Asian carriers' international traffic was down 13% in December as against 22% in the previous month.
Consequently, we now see 2002 as being just marginally negative — having decreased the negative traffic forecast for the first eight months and increased the positive forecast for the last four. Global RPKs are put at -1% against our previous estimate of -5%.
2003 is still the year when traffic rebounds. The recalculated rebound is 14% globally, less spectacular than the 17% we originally guessed but still very powerful. The assumption behind this forecast is that traffic will revert to the level it would have been at if September 11 had not happened (for the US we modify this assumption to 95% of the level traffic would have been at). For comparison, there was a 9% resurgence in 1992. At present the recovery in traffic is being driven by greatly reduced yields, the result of both a deteriorating business/economy mix and across the board discounting. The ATA, which is the only industry body to regularly publish such data, estimates that US average fares were down 15% domestically and 14% internationally in December compared to the previous year.
This means that the traffic recovery will not translate quickly into a profits recovery. 2002 will, however, be better than the $13bn net loss we estimated in the December 2001 issue; it could be much better but only if further deep cost cutting is pursued. As much of the bad news as possible will be dumped into the airlines' 2001 results, and the global loss figure will look horrendous — perhaps a $14bn net loss (against our recent forecast of $9bn).
Capacity adjustments in the post–September 11 market have been made rapidly — through parking surplus aircraft and, in Europe, through airline bankruptcies. So load factors have remained relatively stable. The AEA load factor was down just 1% for December and 2.1% for the year, whereas US carriers' load factor was down 2.5% for December and the same for the year.
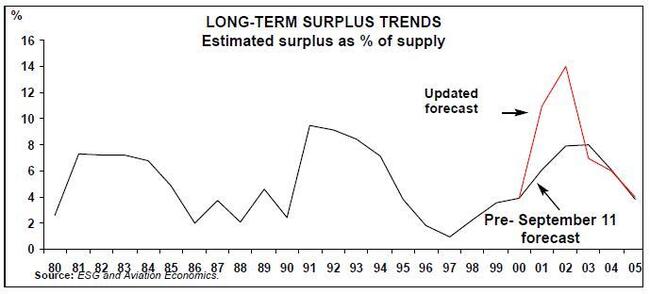
So the demand/supply balance has adjusted through reduced utilisation plus adjustments in aircraft types, and most importantly parking. Our new estimate of the global aircraft surplus is 11% average for 2001 and 14% average for 2002, which look terrible in comparison to the 9% surpluses experienced in the early 90s.
The October 2001 issue of Aviation Strategy explained the methodology behind the surplus assessments. The two main changes incorporated in this update are the new traffic numbers and another assessment of the main manufacturers output this year.
Boeing and Airbus got remarkably close the achieving their output targets last year, although many of the recent deliveries have been parked immediately. For 2002, we are opting for 260 deliveries from Airbus against the 300–plus that it states it will be able to force operators to take. For Boeing, 330 deliveries are in the forecast, again below the officially anticipated output.
The surplus calculated for 2002 is equivalent to 2,250 jet units, which turns out to be disturbingly close to the total for aircraft now officially parked. According to Acas, there were about 2,100 parked jets as at the end of 2001 — details overleaf.
Could it be that September 11 has caused a one–off restructuring of the market with the problem of the surplus being neatly solved by decommissioning economically obsolete types? That seems almost too good to be true, yet it looks as if about 1,800 of this total are unlikely to re–enter the passenger market in the developed world. The exceptions are the A320 types, the 737NGs plus the 737- 400s and the 747–400s.
What then is to be done with the rest? Many are suited for nothing better than recycling into aluminium, and others like the A300s and MD–11s are candidates for freighter conversion, but this still leaves a large number of perfectly serviceable, if somewhat elderly and noisy, types searching for a role.
The obvious place for them to go is where they are needed — in the Third World and Russia.
But bureaucratic barriers in the form of import taxes and continuing state protection for inefficient flag–carriers will continue to frustrate.
- Cutting overheads is vital for BA but it cannot get close to the low–costs, whose managers are happy to work in converted hangars.
Year-on-year changes in global RPK
| US | Euro | Asian | World | |||||||||
|---|---|---|---|---|---|---|---|---|---|---|---|---|
| Dom | Int | Total | Dom | Int | Total | Dom | Int | Total | Dom | Int | Total | |
| 2000 | 6% | 7% | 6% | 2% | 7% | 7% | 9% | 11% | 11% | 5% | 9% | 7% |
| 2001 | -7% | -8% | -8% | -1% | -7% | -6% | 1% | -2% | -1% | -5% | -5% | -5% |
| 2002 | -2% | -2% | -2% | 2% | -1% | 0% | 2% | -1% | 0% | -1% | -1% | -1% |
| 2003 | 11% | 15% | 12% | 5% | 15% | 14% | 13% | 20% | 18% | 11% | 17% | 14% |
| 2004 | 5% | 6% | 5% | 5% | 6% | 6% | 7% | 8% | 8% | 5% | 7% | 6% |
| 2005 | 5% | 6% | 5% | 5% | 6% | 6% | 7% | 8% | 8% | 5% | 7% | 6% |
| 727 | 737 | A320 | DC-9 | MD-80 | 747 | 757/ | A300 | A330 | DC-10 | DC-8 | L1011 | MD-11 | Bae146/ | RJs | Other | Total | ||||
|---|---|---|---|---|---|---|---|---|---|---|---|---|---|---|---|---|---|---|---|---|
| 2/300 | 4/500 | NG | fam. | 2/300 | 400 | 767 | /310 | /340 | F100 | |||||||||||
| United Airlines | 75 | 24 | 5 | 1 | 2 | 107 | ||||||||||||||
| US Airways | 59 | 1 | 3 | 11 | 3 | 30 | 107 | |||||||||||||
| GECAS | 11 | 3 | 4 | 16 | 9 | 8 | 1 | 6 | 6 | 2 | 1 | 8 | 75 | |||||||
| Federal Express | 8 | 1 | 7 | 40 | 10 | 66 | ||||||||||||||
| Delta Air Lines | 14 | 1 | 2 | 32 | 49 | |||||||||||||||
| Iberia | 8 | 25 | 6 | 39 | ||||||||||||||||
| Pegasus Aviation | 14 | 1 | 5 | 3 | 2 | 4 | 1 | 6 | 2 | 38 | ||||||||||
| Boeing Capital Corp | 3 | 11 | 12 | 1 | 2 | 2 | 3 | 34 | ||||||||||||
| American Airlines | 19 | 2 | 4 | 3 | 1 | 3 | 32 | |||||||||||||
| Finova Capital | ||||||||||||||||||||
| Corp | 10 | 1 | 3 | 4 | 1 | 2 | 5 | 1 | 27 | |||||||||||
| Emery Worldwide | 18 | 8 | 26 | |||||||||||||||||
| ILFC | 1 | 6 | 6 | 2 | 10 | 1 | 26 | |||||||||||||
| British Airways | 8 | 12 | P> | 4 | 24 | |||||||||||||||
| Lufthansa | 9 | 3 | 2 | 5 | 4 | 1 | 24 | |||||||||||||
| Avborne Group Inc | 22 | 22 | ||||||||||||||||||
| Custom Air | 5 | 17 | 22 | |||||||||||||||||
| Continental | ||||||||||||||||||||
| Airlines | 1 | 5 | 2 | 5 | 8 | 21 | ||||||||||||||
| Air Canada | 7 | 7 | 3 | 1 | 2 | 20 | ||||||||||||||
| Air Canada Regional | 19 | 19 | ||||||||||||||||||
| Okada Air | 1 | 18 | 19 | |||||||||||||||||
| Air Lib | 4 | 2 | 12 | 18 | ||||||||||||||||
| Ansett Australia | 2 | 7 | 9 | 18 | ||||||||||||||||
| Northwest Airlines | 6 | 2 | 9 | 17 | ||||||||||||||||
| Republic Financial | ||||||||||||||||||||
| Corp | 13 | 2 | 1 | 16 | ||||||||||||||||
| Ansett Worldwide | 6 | 2 | 4 | 3 | 15 | |||||||||||||||
| Kalitta Air | 1 | 7 | 2 | 5 | 15 | |||||||||||||||
| Sabena | 11 | 3 | 14 | |||||||||||||||||
| SAS | 10 | 4 | 14 | |||||||||||||||||
| Wells Fargo | 5 | 3 | 2 | 3 | 1 | 14 | ||||||||||||||
| International Air | ||||||||||||||||||||
| Leases | 3 | 1 | 2 | 7 | 13 | |||||||||||||||
| Iraqi Airways | 6 | 4 | 3 | 13 | ||||||||||||||||
| Kabo Air | 2 | 7 | 4 | 13 | ||||||||||||||||
| Boeing Holding Corp | 1 | 7 | 2 | 2 | 12 | |||||||||||||||
| Int. Airline Support | ||||||||||||||||||||
| Group | 1 | 11 | 12 | |||||||||||||||||
| Kendell Airlines | 12 | 12 | ||||||||||||||||||
| Debis Airfinance | 1 | 2 | 3 | 5 | 11 | |||||||||||||||
| Merpati | 11 | 11 | ||||||||||||||||||
| Southwest Airlines | 11 | 11 | ||||||||||||||||||
| Airplanes Group | 2 | 1 | 1 | 3 | 3 | 10 | ||||||||||||||
| European Av. Air | ||||||||||||||||||||
| Charter | 4 | 6 | 10 | |||||||||||||||||
| Others (486 | ||||||||||||||||||||
| owners) | 202 | 129 | 9 | 5 | 29 | 78 | 46 | 91 | 3 | 36 | 46 | 9 | 37 | 74 | 62 | 5 | 70 | 28 | 73 | 1,032 |
| TOTAL | 423 | 274 | 17 | 20 | 55 | 174 | 96 | 147 | 11 | 95 | 74 | 28 | 126 | 92 | 154 | 21 | 161 | 48 | 82 | 2,098 |