1,000+ deliveries as markets turn down
February 1999

For all the talk about the greater maturity of the global airline business as the millennium ends, something distressingly familiar is taking place in 1999 — jet aircraft deliveries are peaking at exactly the same time as traffic is faltering and yields are falling.
In fact, 1999 will almost certainly be the peak year for deliveries, probably exceeding the 1,000 unit mark for the first time. Boeing has announced that it expects to deliver about 620 aircraft this year — up from 563 in 1998 — while Airbus is predicting 290 deliveries this year compared with 229 in 1998. Figures for the other manufacturers are not as easily available, but with the boom in regional jet demand, deliveries of around 150 units is conceivable. This brings the total deliveries expected in 1999 to about 1,050.
Most of the industry analysts are in the same region. For example, Chris Avery of Paribas is estimating 915 deliveries for this year, but only for jets with greater than 70 seats. Ed Greenslet’s (ESG’s) current, but soon to be updated, forecast is for 1,000 units for all jet types. Incidentally, the next year in which ESG forecasts 1,000–plus deliveries is 2008.
Where’s it going?
So what type of capacity is going where? Aviation Strategy has provided a rough guideline in the table above. We have identified, as far as is possible, scheduled deliveries to airlines in the three main areas of the world, then compared the seats to be delivered with the 1998 passenger fleet. Note that no deletions have been factored in.
The following possible trends can be identified. There is going to be a surge in capacity in the North American regional jet supply as airlines continue to switch from turboprops to jets. Demand and profits have been very healthy in this sector, and it is probable that this level of capacity increase can be absorbed. However, Europe is a cycle behind North America in this sector, and there is currently little interest in the Asia/Pacific region.
In the 150–seater sector most of the US Majors and a significant number of the European flag–carriers are embarking on fleet renewal programmes with new generation 737s and the A320 family, while the European new entrants are starting to account for a sizeable proportion of new capacity. The worrying figure is the possible capacity increase in the Asian fleet, a figure that has been swollen by deferrals from 1998.
With domestic and intra–regional traffic still very depressed, it is inevitable that some of this capacity will be recycled to the West, potentially disturbing market balance in the same way as the large jet sector is being impacted.
At least one of the US Majors, United, has a plan to cope with this scenario — the accelerated retirement of older Chapter 2 types. The problem is that reduction in capacity by one airline has little effect on the overall market: in a recession the level of load factors and yields will increasingly be determined by the weakest carriers — those that operate depreciated but hush–kitted equipment.
Great faith is put in the capacity–reducing effect of the implementation of Chapter 2 non–operation rules between 2000 and 2003, but the level of scrapping remains disconcertingly modest.
The never-ending cycle
Serious increases in US and European capacity in the A340/A330/777 sector are also evident as airlines continue to downsize from 747 types.
Again one can see the tyranny of the aviation cycle. These types have been presented as the key to enhancing airline profitability by allowing airlines to effectively attack the business sector. They enable airlines to capture business travel by increasing frequencies over 747–type operations and they are also supposed to allow airlines to push up yield as they are typically configured with a higher percentage of business class seats than the 747 (or, to put it another way, airlines have fewer economy seats to bother with).
However, these aircraft are going to be delivered en masse at a time when the lucrative business travel market — having been very strong for some years — is starting to weaken.
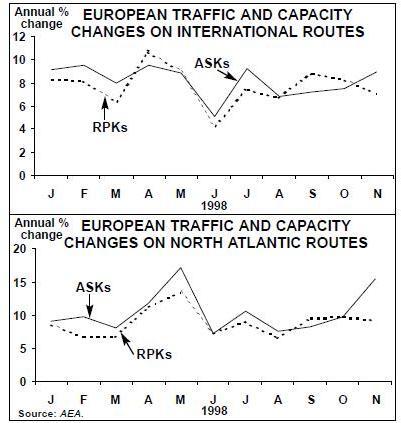
Evidence of a deterioration in the market balance is mounting. The AEA figures for November, for example, show a 1.1 percentage point fall in overall load factors, but with really alarming developments on the North Atlantic. Here traffic grew by a very respectable 9.3% but capacity surged by 15.4% as aircraft were diverted from Asian routes.
If it were just a case of demand/supply imbalance the airlines might not be overly concerned. They now have some measure of control over market capacity via their global alliance strategies and the megaorders placed with sole suppliers. This allows the airlines to alter the timing of deliveries if necessary.
Yield trouble
What is really distressing is the erosion in yield. This is becoming apparent in the US market (see page 8) but appears to be particularly painful at British Airways, whose share price has been battered largely because of fears over falls in yield. In its third quarter (October–December 1998) the airline reported that its premium traffic had declined by 2.9%, although non–premium traffic growth was still at 13.6%.
The implication is that, also taking into account adverse currency movements, British Airways’ passenger yield will show a decline of at least 6% for the year. Yield management systems, which a year ago were regarded as nearly omnipotent, now look fallible.
British Airways’ experience has been attributed to alliance–based competition taking off — i.e. to Star stealing business passengers. But the anecdotal evidence suggests that the most important influence has simply been a change in business travel demand.
It is now becoming very important for the marketing departments of airlines to assess as accurately as possible how much premium revenue is being lost as a result of fewer trips undertaken, of greater resistance to fares that have been ruthlessly pushed up in recent years and through downgrading to economy class. At present the only visible response of the airlines most exposed to the danger of premium traffic erosion has been to reduce the restrictions on business tickets.
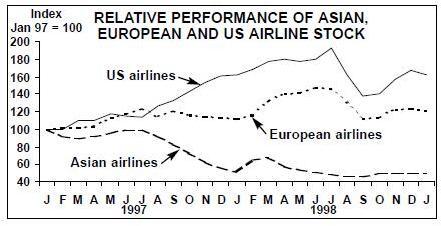
Perhaps the group of people most keenly attuned to changes in corporate travel patterns are the airline stock–market analysts themselves, whose employers — the investment banks — are among the most extensive users of business–class seats but are also the most ruthless at cutting costs if they perceive a change in business conditions.
As the graph above shows, European airlines stocks remain in the slump they fell into last summer, while US stocks, having staged a recovery in the second half of 1998, have turned down again. It is still not polite to talk about Asian airline stocks.
| North America | Europe | Asia | Total | |
|---|---|---|---|---|
| Regional jets | 17% | 8% | 0% | 11% |
| 150-seaters | 12% | 14% | 14% | 11% |
| 300-seaters | 15% | 15% | 12% | 14% |
| 747s | 12% | 7% | 3% | 6% |
| TOTAL | 13% | 12% | 9% | 12% |